Liberalization Increases Growth
In Assessing Economic Liberalization Episodes: A Synthetic Control Approach (wp version), Billmeier and Nannicni evaluate economic liberalizations, defined as “comprehensive reforms that extend the scope of the market, and in particular of international markets,” over the period 1963-2005. The authors compare real per-capita GDP in treatment countries with that in a synthetic control, a weighted average of similar countries with the weights optimized so that the synthetic control matches as well as possible a variety of pre-treatment characteristics including secondary school enrollment, population growth, and the investment share as well as GDP. The results are often impressive, for example.
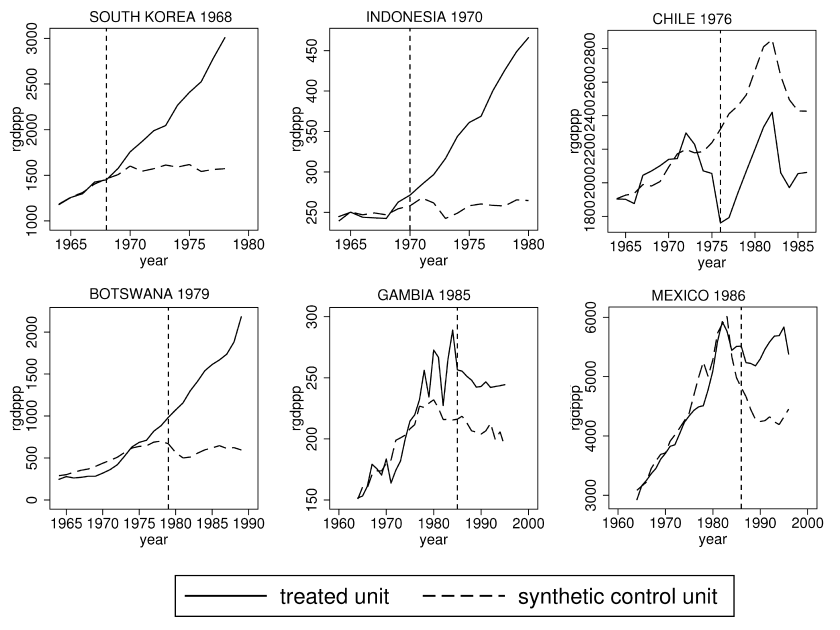
[In Indonesia] the average income over the years before liberalization is literally identical to that of the synthetic control, which consists of Bangladesh (41%), India
(23%), Nepal (23%), and Papua New Guinea (13%). After the economic liberalization in 1970, however, Indonesian GDP per capita takes off and is 40% higher than the estimated counterfactual after only five years and 76% higher after ten years.
Here is a selection of figures (see the paper for more). In each case the solid line is the liberalizing country and the dashed line the synthetic control.
To be sure, not all liberalizations are successful. In particular, liberalizations in Africa especially after 1991 appear to be less successful. Whether this is because these liberalizations were half-hearted, were not combined with other institutional improvements or because countries that liberalized earlier were better able to link to global supply chains, is unclear. See the paper for more discussion.
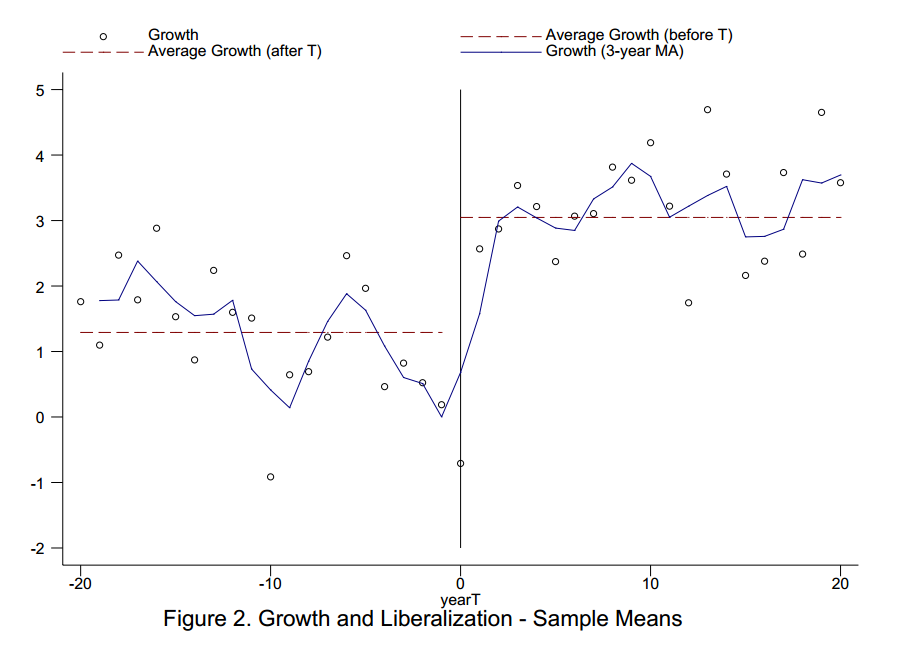
These results bolster similar earlier findings from Warciarg and Welch (2008) who, using different methods, examined the average effect of liberalizations on growth from a wide variety of countries over a 50 year period. They found that on average growth increased after liberalization by a remarkable 1.5 percentage points. Here is the key figure.
See Development and Trade: The Empirical Evidence, a video from MRU, for more on the WW study as well as other types of evidence.