Category: Data Source
Which nations have cultural inferiority complexes?
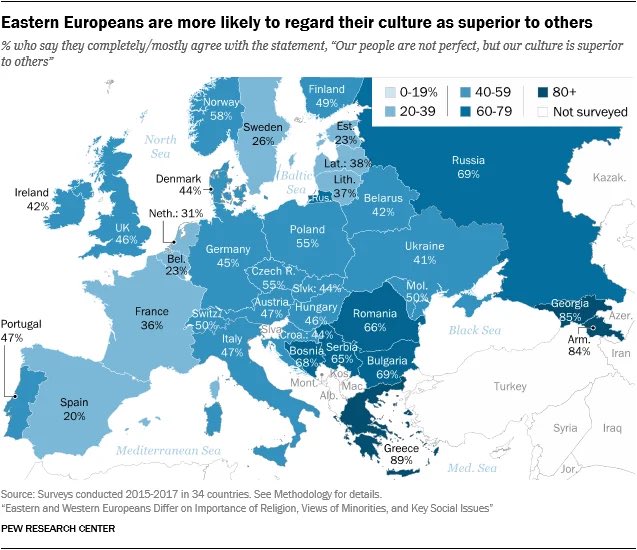
Here is the link, via the wisdom of Garett Jones. And OK, which nations have the cultural inferiority complexes? The ones that rate themselves highly, or the converse?
The Gender Gap in Confidence: Expected but Not Accounted For
We investigate how the gender gap in confidence affects the views that evaluators (e.g., employers) hold about men and women. We find the confidence gap is contagious, causing evaluators to form overly pessimistic beliefs about women. This result arises even though the confidence gap is expected and even though the confidence gap shouldn’t be contagious if evaluators are Bayesian. Only an intervention that facilitates Bayesian updating proves (somewhat) effective. Additional results highlight how similar findings follow even when there is no room for discriminatory motives or differences in priors because evaluators are asked about arbitrary, rather than gender-specific, groups.
That is a new piece by Christine L. Exley and Kirby Nielsen in the new March 2024 AER.
Map of the day model this mother distance what else besides population density
This is one of the most fascinating charts I’ve ever seen.
Been staring at it all morning trying to draw assumptions from it pic.twitter.com/vG01VRNExu
— Ben Little (@TRUmav) February 19, 2024
I am tired of making this point
Both rightists and leftists assume that the U.S. spends far lower to combat social problems (poverty, healthcare, education) than peer nations, but that is not true. pic.twitter.com/CXdVDNWb6p
— David (@Data_David1) February 18, 2024
Here Robin Hanson notes that social spending as a percent of gdp tends to rise almost universally:
Key question: will these trends continue over the next two centuries even if innovation grinds to a halt due to falling population? https://t.co/ysBMuGiX5b
— Robin Hanson (@robinhanson) February 18, 2024
Do recessions benefit our health?
That is the topic of my latest Bloomberg column, here is one excerpt:
The human and economic costs of recessions are deep and well-documented. They can also have real health benefits, however, and seldom are they expressed so starkly as in this sentence in a new paper from the National Bureau of Economic Research: “The Great Recession provided one in twenty-five 55-year-olds with an extra year of life.”
…Overall, the paper notes, age-adjusted mortality in the US fell by 2.3% during the Great Recession. The finding, from professors at MIT, the University of Chicago and McMasters University, broadly tracks previous research showing that that mortality rates rise in good times and fall in hard times.
And:
One answer is related to air pollution, which is lower in recessions, typically because of reduced economic activity. The benefits of lower pollution levels persist long after the recession — at least 10 years, according to the researchers’ estimates. Air pollution reduction accounts for more than one-third of the mortality benefits from the Great Recession.
And all of this:
The data do provide some additional clues. Except for cancer, for example, all major causes of mortality fell during the Great Recession. Decreases in cardiovascular-related deaths accounted for about half the mortality gains during that time. Furthermore, the mortality benefits were concentrated among Americans without college degrees. You might think that some of these improved health outcomes were due to people losing their stressful, low-paying jobs, but unemployment can be pretty stressful too.
For a 55-year-old, according to the paper’s estimates, about one-quarter of the economic costs of the Great Recession were countered by these mortality gains. So the Great Recession was still a very bad event — just less bad than we used to think. That is especially true for less educated Americans, who were hit harder by unemployment but also reaped the mortality gains.
At the top end of the age distribution, Americans aged 65 and older didn’t lose much from the Great Recession, in part because so many were already retired or working only part-time (in some cases, they were ensconced in jobs they were not going to lose). The researchers estimate that those over age 60 were also better off, on net, from the Great Recession.
Worth a ponder. Here is the original paper by
Lithium
WEF 2002: The world could face lithium shortages by 2025, the International Energy Agency (IEA) says, while Credit Suisse thinks demand could treble between 2020 and 2025, meaning “supply would be stretched”.
Reuters 2023: Lithium producers are growing anxious that delays in mine permitting, staffing shortages and inflation may hinder their ability to supply enough of the battery metal to meet the world’s aggressive electrification timelines.
GEP 2023: Lithium faces supply shortages due to past underinvestment amid surging electric vehicle demand.
This list could easily be extended. In contrast here from Nat Bullard’s presentation is data on battery prices per kilowatt-hour. Note that almost all of the above is very short-term extrapolation from the price increase in 2022. As Tyler says, do not underrate the elasticity of supply.
But I haven’t yet given you my favorite headline on this topic, an all-time classic:
Lithium Price Crash Could Trigger Shortages From 2025

The California tax burden is driving people out
That is the topic of my latest Bloomberg column, here is one bit:
California’s highest income tax rate is 13.3%. That is in addition to a top federal tax rate of 37%. California also has a state sales tax rate of 7.25%, and many localities impose a smaller sales tax. So if a wealthy person earns and spends labor income in the state of California, the tax rate at the margin could approach 60%. Then there is the corporate state income tax rate of 8.84%, some of which is passed along to consumers through higher prices. That increases the tax burden further yet.
And this:
Researchers Joshua Rauh and Ryan Shyu, currently and formerly at Stanford business school, have studied the behavioral response to Proposition 30, which boosted California’s marginal tax rates by up to 3% for high earners for seven years, from 2012 to 2018. They found that in 2013, an additional 0.8% of the top bracket of the residential tax base left the state. That is several times higher than the tax responses usually seen in the data.
These high-earning California residents seem to have reached a tipping point: Maybe many of them could afford the extra tax burden, but at some point they got fed up, read the signals and decided the broader system wasn’t working in their interest.
Overall, Proposition 30 increased total tax revenue for California — but not nearly as much as intended. Due to departures, the state lost more than 45% of its windfall tax revenues from the policy change, and within two years the state lost more than 60% of those same revenues.
Sticky norms
Shanhong Luo, a professor at Fayetteville State University, studies the factors behind attraction between romantic partners, including the norms that govern relationships. In a paper published in 2023 in Psychological Reports, a peer-reviewed journal, Dr. Luo and a team of researchers surveyed 552 heterosexual college students in Wilmington, N.C., and asked them whether they expected men or women to pay for dates — and whether they, as a man or a woman, typically paid more.
The researchers found that young men paid for all or most of the dates around 90 percent of the time, while women paid only about 2 percent (they split around 8 percent of the time). On subsequent dates, splitting the check was more common, though men still paid a majority of the time while women rarely did. Nearly 80 percent of men expected that they would pay on the first date, while just over half of women (55 percent) expected men to pay.
Surprisingly, views on gender norms didn’t make much of a difference: On average, both men and women in the sample expected the man to pay, whether they had more traditional views of gender roles or more progressive ones.
Here is more from the NYT.
Correlations between spouses
Correlations between spouses
Extraversion: r= .005
Neuroticism: .082
Height: .227
Weight: .154
Education: .5
Political party: .6"Mates tend to be positively but weakly concordant on personality and physical traits, but concordance of political attitudes is extremely high" pic.twitter.com/BmdpySfakh
— Rob Henderson (@robkhenderson) February 10, 2024
Is Science a Public Good?
Science seems like a public good; in theory, ideas are non-rivalrous and non-excludable. But the closer we look at how ideas actually spread and are used in the world, the less they seem like public goods. As I am fond of pointing out, Thomas Keller wrote a literal recipe book for the dishes he served at his world famous French Laundry restaurant and yet, the French Laundry did not go out of business. Ideas are in heads and if you don’t move the heads, often the ideas don’t move either.
In a new NBER working paper, The Effect of Public Science on Corporate R&D by Arora, Belenzon, Cioaca, Sheer & Zhang, (Tyler mentioned it briefly earlier) the authors make a similar point:
…the history of technical progress teaches us that abstract ideas are also difficult to use. Ideas have to be tailored for specific uses, and frequently, have to be embodied in people and artifacts before they can be absorbed by firms. However, such embodiment also makes ideas less potent sources of increasing returns, turning non-rival ideas into rival inputs, whose use by rivals is easier to restrict. Our findings confirm that firms, especially those not on the technological frontier, appear to lack the absorptive capacity to use externally supplied ideas unless they are embodied in human capital or inventions. The limit on growth is not the creation of useful ideas but rather the rate at which those ideas can be embodied in human capital and inventions, and then allocated to firms to convert them into innovations.
The question of whether science is a public good is not merely technical but has significant implications. If science is a public good, markets will likely underproduce it, making government subsidies to universities crucial for stimulating R&D and economic growth. Conversely, if ideas are embodied and thus closely tied to their application, government funding for university research might not only fail to enhance economic growth but could also hinder it. This occurs as subsidies draw scientists away from firms, where their knowledge directly contributes to product development, towards universities, where their insights risk becoming lost in the ivory tower. (Teaching scientists who then go on to careers in the private sector is much more likely to be complementary to productivity growth than funding research which pulls scientists away from the private sector.)
In a commentary on Arora et al., the Economist notes that growth in universities and government science has coincided with a slowdown in productivity.
Universities have boomed in recent decades. Higher-education institutions across the world now employ on the order of 15m researchers, up from 4m in 1980. These workers produce five times the number of papers each year. Governments have ramped up spending on the sector. The justification for this rapid expansion has, in part, followed sound economic principles. Universities are supposed to produce intellectual and scientific breakthroughs that can be employed by businesses, the government and regular folk. Such ideas are placed in the public domain, available to all. In theory, therefore, universities should be an excellent source of productivity growth.
In practice, however, the great expansion of higher education has coincided with a productivity slowdown.
Arora et al. present detailed empirical evidence causally linking the productivity slowdown to the expansion of government science. Government science has yielded smaller-than-expected productivity improvements due to significant trade-offs. Subsidies have moved heads out of firms and into universities and for many firms this shift of talent has not only reduced the firms’ capacity to generate ideas (crowding out) but has also impaired their ability to adopt academic innovations. As the authors write:
…productivity growth may have slowed down because the potential users—private corporations—lack the absorptive capacity to understand and use those ideas.
The great Terence Kealey made many of these points much earlier in his important book, The Economic Laws of Scientific Research (here is an online precis). Kealey, however, was challenging a beautiful theory, supported by the great and good of the economics profession, by pointing to an ugly practice. Arora et al. show that the beauty of the theory may have misguided us and that “the vast fiscal resources devoted to public science…probably make businesses across the rich world less innovative” (quoting the Economist).
The Global Distribution of College Graduate Quality
We measure college graduate quality—the average human capital of a college’s graduates—for graduates from 2,800 colleges in 48 countries. Graduates of colleges in the richest countries have 50% more human capital than graduates of colleges in the poorest countries. Migration reinforces these differences: emigrants from poorer countries are highly positively selected on human capital. Finally, we show that these stocks and flows matter for growth and development by showing that college graduate quality predicts the share of a college’s students who become inventors, engage in entrepreneurship, and become top executives both within and across countries.
That is a new JPE piece by Paolo Martellini, Todd Schoellman, and Jason Sockin.
New data on media bias
In this study, we propose a novel approach to detect supply-side media bias, independent of external factors like ownership or editors’ ideological leanings. Analyzing over 100,000 articles from The New York Times (NYT) and The Wall Street Journal (WSJ), complemented by data from 22 million tweets, we assess the factors influencing article duration on their digital homepages. By flexibly controlling for demand-side preferences, we attribute extended homepage presence of ideologically slanted articles to supply-side biases. Utilizing a machine learning model, we assign “pro-Democrat” scores to articles, revealing that both tweets count and ideological orientation significantly impact homepage longevity. Our findings show that liberal articles tend to remain longer on the NYT homepage, while conservative ones persist on the WSJ. Further analysis into articles’ transition to print and podcasts suggests that increased competition may reduce media bias, indicating a potential direction for future theoretical exploration.
That is from a recent paper by Tin Cheuk Leung and Koleman Strumpf.
Student Demand and the Supply of College Courses
From a recent Jacob Light paper:
In an era of rapid technological and social change, do universities adapt enough to play their important role in creating knowledge? To examine university adaptation, I extracted the information contained in the course catalogs of over 450 US universities spanning two decades (2000-2022). When there are changes in student demand, universities respond inelastically, both in terms of course quantity and content. Supply inelasticity is especially pronounced in fields experiencing declining demand and is more pronounced at public universities. Using Natural Language Processing, I further show that while the content of existing courses remains largely unchanged, newly-created courses incorporate topics related to current events and job skills. Notably, at selective institutions, new content focuses on societal issues, while at less selective institutions, new content emphasizes job-relevant skills. This study contributes uniquely to our understanding of the supply-side factors that affect how universities adapt to the rapidly evolving landscape.
John Cochrane offers comment as well, the first half of the post is interesting on demographics also.
Religion and the ideological gender gap
The key insight is that women have always been more [economically] left-wing than men, but that women were also more religious (both vs today and vs men) and that this was a moderating force against those left-wing views.
With religion in retreat, those views now take voice. pic.twitter.com/Ed3GJyHhap
— John Burn-Murdoch (@jburnmurdoch) February 2, 2024
Matriline versus Patriline: Social Mobility in England, 1754-2023
Greg Clark may well be the most important social scientist of the 21st century. His use of historical data informed by evolutionary theory and genetics is a unique contribution to social science with important and challenging results.
Clark’s latest paper (with Neil Cummins) makes a simple but striking point. If the primary systematic determinant of social outcomes is genetic then we expect the father and the mother to contribute equally (each giving half their genes). If, on the other hand, the primary determinant is social then we expect widely different mother-father contributions in different societies and at different times and for different characteristics. Fathers ought to matter more in patriarchies, for example, and mothers more in matriarchies and gender-egalitarian societies. Similarly, if social factors are determinative, we would surely see a rising contribution of mothers to child outcomes as the social power of women rises (you can’t use your mother’s contacts in the legal profession to get a job, for example, if your mother was never a lawyer.) Similarly, if social factors are determinative we would expect mothers to be more important perhaps for characteristics determined early and fathers for characteristics determined late.
As Clark and Cummins write:
Social institutions and conventions would suggest that social status will often be more strongly transmitted between generations on either the patriline or the matriline. The factors favoring stronger transmission on the matriline are the much greater involvement in all societies of mothers in the care and education of children. The greater time investment of mothers in childcare is found in all societies, even those such as in contemporary Nordic countries where gender equality is the most advanced. Thus we would on the human capital interpretation of social outcomes expect a greater maternal than paternal connection in the modern world. However, a countervailing force in earlier times was the greater access of fathers to resources, and professional contacts. Also since in earlier years only fathers had occupations and educational qualifications, the father could be much more of a model for the outcomes of sons. It is thus uncertain whether the paternal or maternal line would better predict social outcomes in any earlier society. But we would expect the paternal effect to be greater in high status groups, and the maternal effect greater in average or lower class families.
What we find with the FOE data, however, is that in 27 out of 31 child outcomes (other than wealth) examined across marriages in the years 1754-1995, the patriline and matriline had a predictive ability for child outcomes that was not statistically distinguishable at the 5% level. In the four cases where the coefficients differed significantly, in three the maternal effect was greater, and in one the paternal effect. Thus for most social outcomes – literacy, age at beginning work, age at leaving schooling, higher education, and occupational status – mother and fathers appear always to contribute roughly equally. The one clear exception is wealth, where always patriline wealth is a much stronger predictor of child wealth than is matriline wealth.
…The results suggest, however, that the mechanism of transmission is largely independent of parental time interacting with children. The results reported above are thus consistent with the finding of Clark (2023) that the pattern of inheritance of most social outcomes in England 1600-2022 was consistent with direct additive genetic transmission. Such transmission would imply a symmetry of mother and father predictive effects.