Results for “schularick” 10 found
Populism fact of the day
Populism at the country level is at an all-time high, with more than 25% of nations currently governed by populists. How do economies perform under populist leaders? We build a new long run cross- country database to study the macroeconomic history of populism. We identify 51 populist presidents and prime ministers from 1900 to 2020 and show that the economic cost of populism is high. After 15 years, GDP per capita is 10% lower compared to a plausible non-populist counterfactual. Economic disintegration, decreasing macroeconomic stability, and the erosion of institutions typically go hand in hand with populist rule.
That is a new piece by Manuel Funke, Moritz Schularick, and Christoph Trebesch, forthcoming in The American Economic Review, arguably the number one journal of the economics profession.
Substitutes Are Everywhere: The Great German Gas Debate in Retrospect
In March of 2022 a group of top economists released a paper analyzing the economic effects on Germany of a stop in energy imports from Russia (Bachmann et al. 2022). Using a large multi-sector mathematical model the authors concluded that if prices were allowed to adjust, even a substantial shock would have relatively low costs. In contrast, the German chancellor warned that if the Russians stopped selling oil to Germany “entire branches of industry would have to shut down” and when asked about the economic models he argued that:
[the economists] get it wrong! And it’s honestly irresponsible to calculate around with some mathematical models that then don’t really work. I don’t know absolutely anyone in business who doesn’t know for sure that these would be the consequences.
The Chancellor was not alone in predicting big economic losses; some studies estimated reductions in output of 6-12% and millions of unemployed workers. The key distinction between the economists and the others was in their understanding of elasticities of substitution. When the Chancellor and the average person think about a 40% reduction in natural gas supplies, they implicitly assume that each natural gas-dependent industry must cut its usage by 40%. They then consider the resulting decline in output and the cascading effects on downstream industries. It’s easy to get very worried using this framework.
When the economists replied that there were opportunities for substitution they were typically met with disbelief and misunderstanding. The disbelief stemmed from a lack of appreciation of the many opportunities for substitution that permeate an economy. In our textbook, Modern Principles, Tyler and I explain how the OPEC oil shock in the 1970s led to an increase in brick driveways (replacing asphalt) and the expansion of sugar cane plantations in Brazil (for ethanol production). Amazingly, the oil shock also prompted flower growers to move production overseas, as the reduction in heating oil costs from growing in sunnier climates outweighed the increase in transportation fuel expenses. While these examples highlight long-term changes, short-term substitutions are also possible, though their precise details are usually hidden from central planners and economists.
 The misunderstanding came from thinking that we need every user of fuel to find substitutes. Not at all! In reality, as fuel prices rise, those with the lowest substitution costs will switch first, freeing up fuel for users who have more difficulty finding alternatives. Just one industry with favorable substitution possibilities, combined with a few moderately adaptable industries, can produce a significant overall effect. Moreover, there are nearly always some industries with viable substitution options. To see why reverse the usual story and ask, if fuel prices fell by 50% could your industry use more fuel? And if fuel prices fell by 50% are their industries that could switch into the now cheaper fuel?
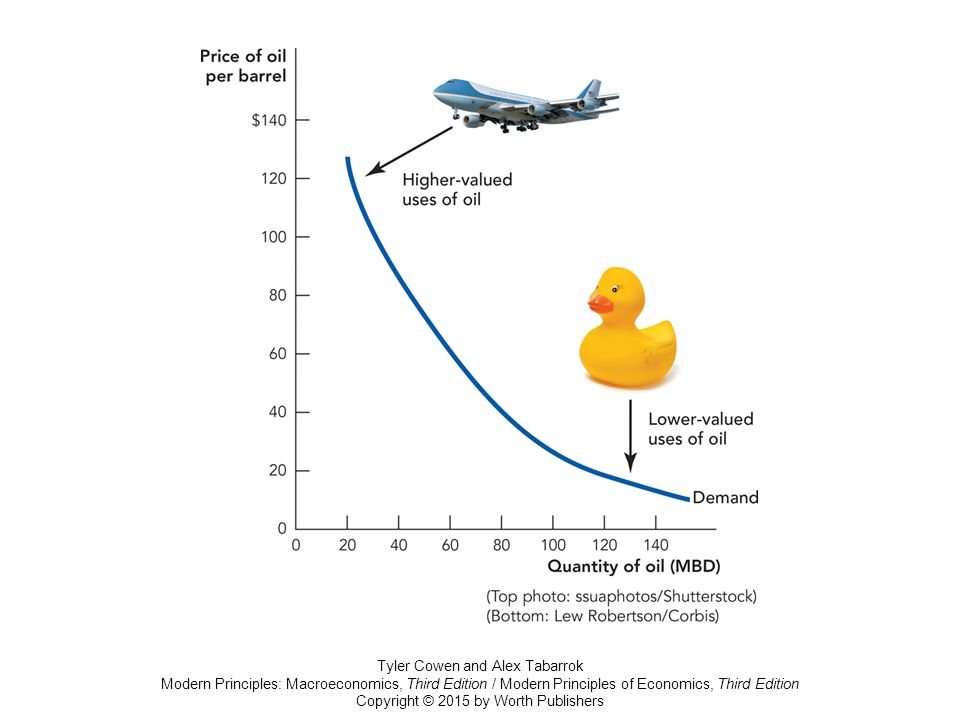
People often find it easier to imagine new uses rather than ways to reduce existing consumption. However, it is typically the new uses that are scaled back first. Tyler and I illustrate this with our jet and rubber ducky graph. Although jet aircraft won’t shift away from oil even at high prices, rubber (actually plastic) duckies, which are made from oil, can find substitutes–wood, for example–when oil prices rise. And if plastic ducky manufacturers cannot find substitutes, they go out of business, freeing up more oil for other uses. In this way, the market identifies the least valuable goods to cease production, another kind of substitution.
Substitution is a more nuanced concept than many people imagine. Here’s another example. Imagine that an economy has an energy-intensive goods producing sector and that there are few substitutes for the fuel used in this sector. Disaster? Not at all. We don’t need a fuel substitute, if we can substitute imports of the energy-intensive goods for domestically produced versions. Storage is also a substitute and notice that the more you substitute away from a fuel in final uses the greater the effective storage. If you use 1 gallon a day a 10 gallon tank lasts 10 days. If you use a quarter gallon a day it lasts 40 days. Everything is connected.
All of these myriad changes happen under the guidance of the invisible hand, i.e. the price system. Remember, a price is a signal wrapped up in an incentive. Thus Bachmann et al. wisely recommended letting energy prices rise to convey the signal and not insuring energy users so the incentive effects were fully felt on the margin.
So what happened? Gas from Russia was indeed cut very substantially but the German economy did not collapse and instead proved as robust as predicted, perhaps even more so. (The Chancellor’s predictions were off the mark but, to be fair, the government also did do a good job in sourcing new supplies and building reserves.) Moll, Schularick, and Zachmann have revisited the analysis and conclude:
The economic outcomes confirm the core theoretical argument that macro elasticities are larger than micro elasticities and that “cascading effects” along the supply chain would be muted as opposed to destroying the economy’s entire industrial sector. As foreseen, producers partly switched to other fuels or fuel suppliers, imported products with high energy content, while households adjusted their consumption patterns….Market economies have a tremendous ability to adapt that was widely underestimated. In addition, the German economics ministry (BMWK) was very successful in quickly sourcing gas supplies from third countries and building LNG capacity. Finally, it probably helped that German policymakers refrained from imposing a price cap on natural gas (like in many other European countries) and instead opted for lumpsum transfers based on households’ and firms’ historical gas consumption.
Hat tip: Alex Wollman.
The case for real estate as investment
That is the topic of my latest Bloomberg column, here is one bit:
The authors of the aforementioned study — Òscar Jordà, Moritz Schularick and Alan M. Taylor — have constructed a new database for the U.S. and 15 other advanced economies, ranging from 1870 through the present. Their striking finding is that housing returns are about equal to equity returns, and furthermore housing as an investment is significantly less risky than equities.
In their full sample, equities average a 6.7 percent return per annum, and housing 6.9 percent. For the U.S. alone, equities return 8.5 percent and housing 6.1 percent, the latter figure being lower but still quite respectable. The standard deviation of housing returns, one measure of risk, is less than half of that for equities, whether for the cross-country data or for the U.S. alone. Another measure of risk, the covariance of housing returns with private consumption levels, also shows real estate to be a safer investment than equities, again on average.
One obvious implication is that many people should consider investing more in housing. The authors show that the transaction costs of dealing in real estate probably do not erase the gains to be made from investing in real estate, at least for the typical homebuyer.
Furthermore, due to globalization, returns on equities are increasingly correlated across countries, which makes diversification harder to achieve. That is less true with real estate markets, which depend more on local conditions.
Do read the whole piece.
The rate of return on everything
There is a new NBER paper on that topic by Òscar Jordà, Katharina Knoll, Dmitry Kuvshinov, Moritz Schularick, and Alan M. Taylor, here is the abstract:
This paper answers fundamental questions that have preoccupied modern economic thought since the 18th century. What is the aggregate real rate of return in the economy? Is it higher than the growth rate of the economy and, if so, by how much? Is there a tendency for returns to fall in the long-run?Which particular assets have the highest long-run returns? We answer these questions on the basis of a new and comprehensive dataset for all major asset classes, including—for the first time—total returns to the largest, but oft ignored, component of household wealth, housing. The annual data on total returns for equity, housing, bonds, and bills cover 16 advanced economies from 1870 to 2015, and our new evidence reveals many new insights and puzzles.
Here is what I learned from the paper itself:
1. Risky assets such as equities and residential real estate average about 7% gains per year in real terms. Housing outperformed equity before WWII, vice versa after WWII. In any case it is a puzzle that housing returns are less volatile but about at the same level as equity returns over a broader time span.
2. Equity and housing gains have a relatively low covariance. Buy both!
3. Equity returns across countries have become increasingly correlated, housing returns not.
4. The return on real safe assets is much more volatile than you might think.
5. The equity premium is volatile too.
6. The authors find support for Piketty’s r > g, except near periods of war. Furthermore, the gap between r and g does not seem to be correlated with the growth rate of the economy.
I found this to be one of the best and most interesting papers of the year.
The Great Moderation and Leverage
In response to my earlier post, The Great Moderation Never Ended, the perceptive Kevin Drum noted that the moderation seems to have been asymmetric–the booms have moderated more than the busts. That’s correct but it’s more than lower economic growth–expansions also last longer. It’s as if the booms have been smoothed over a longer period of time but not the busts.
Søren Hove Ravn points me to a paper of his with co-authors, Leverage and Deepening: Business Cycle Skewness that documents this fact and also proposes a theory.
The authors argue that financial innovation made credit more easily accessible and easier credit led to more leverage. Leverage, however, has an asymmetric feature. When asset prices are up everything is golden, wealth is high and credit is easy because lenders are happy to lend to the rich. When asset prices decline, however, the economy takes a double hit, wealth is low and credit is tight. The net result is that booms are smoothed but busts become, if anything, even more violent.
The theory is promising because it explains both the negative skewness and the great moderation. It’s also important because higher leverage, longer expansions and greater negative skew are new features of business cycles that appear across many developed economies as shown by Jorda, Schularick and Taylor in Macrofinancial History and the New Business Cycle Facts. In this paper Jorda et al. create new data series using over 150 years of data from 17 economies and conclude:
…leverage is associated with dampened business cycle volatility, but more spectacular crashes.
and more generally:
We find that rates of growth, volatility, skewness, and
tail events all seem to depend on the ratio of private credit to income. Moreover, key
correlations and international cross-correlations appear to also depend quite importantly
on this leverage measure. Business cycle properties have changed with the financialization
of economies, especially in the postwar upswing of the financial hockey stick. The manner
in which macroeconomic aggregates correlate with each other has evolved as leverage
has risen. Credit plays a critical role in understanding aggregate economic dynamics.
Does bank capital prevent crises?
Òscar Jordà, Björn Richter, Moritz Schularick, and Alan M. Taylor have a new and somewhat unsettling NBER paper on that topic:
Higher capital ratios are unlikely to prevent a financial crisis. This is empirically true both for the entire history of advanced economies between 1870 and 2013 and for the post-WW2 period, and holds both within and between countries. We reach this startling conclusion using newly collected data on the liability side of banks’ balance sheets in 17 countries. A solvency indicator, the capital ratio has no value as a crisis predictor; but we find that liquidity indicators such as the loan-to-deposit ratio and the share of non-deposit funding do signal financial fragility, although they add little predictive power relative to that of credit growth on the asset side of the balance sheet. However, higher capital buffers have social benefits in terms of macro-stability: recoveries from financial crisis recessions are much quicker with higher bank capital.
Here is Christopher Balding on whether China is deleveraging.
The Austrian theory of the business cycle continues its comeback
Except no one seems interested in calling it by that name. Here is the new NBER working paper by David López-Salido, Jeremy C. Stein, and Egon Zakrajšek, “Credit-Market Sentiment and the Business Cycle”:
Using U.S. data from 1929 to 2013, we show that elevated credit-market sentiment in year t – 2 is associated with a decline in economic activity in years t and t + 1. Underlying this result is the existence of predictable mean reversion in credit-market conditions. That is, when our sentiment proxies indicate that credit risk is aggressively priced, this tends to be followed by a subsequent widening of credit spreads, and the timing of this widening is, in turn, closely tied to the onset of a contraction in economic activity. Exploring the mechanism, we find that buoyant credit-market sentiment in year t – 2 also forecasts a change in the composition of external finance: net debt issuance falls in year t, while net equity issuance increases, patterns consistent with the reversal in credit-market conditions leading to an inward shift in credit supply. Unlike much of the current literature on the role of financial frictions in macroeconomics, this paper suggests that time-variation in expected returns to credit market investors can be an important driver of economic fluctuations.
The paper is here, here are ungated copies. Here are some other related “Austrian” papers.
The resurrection of both Austrian and “risk-based” theories shows how alive and well macro has been of late, but at least in blog land you don’t hear that much about them…
Austrian business cycle theory continues to make a comeback
Just read the abstract from the latest NBER working paper by Òscar Jordà, Moritz HP. Schularick, and Alan M. Taylor:
Is there a link between loose monetary conditions, credit growth, house price booms, and financial instability? This paper analyzes the role of interest rates and credit in driving house price booms and busts with data spanning 140 years of modern economic history in the advanced economies. We exploit the implications of the macroeconomic policy trilemma to identify exogenous variation in monetary conditions: countries with fixed exchange regimes often see fluctuations in short-term interest rates unrelated to home economic conditions. We use novel instrumental variable local projection methods to demonstrate that loose monetary conditions lead to booms in real estate lending and house prices bubbles; these, in turn, materially heighten the risk of financial crises. Both effects have become stronger in the postwar era.
The piece is called “Betting the House,” and you will find some non-gated copies here. And to my Austrian-oriented readers, please don’t let this evidence push you away from more synthetic accounts of what is going on…
Here is FTAlphaville coverage of the paper. And here is an interesting paper on interest rates and equity extraction.
Alan Taylor on mortgage lending as predicting financial crises
He has a new paper (pdf) on this topic, with Jorda and Schularick, based on data from seventeen advanced economies since 1870. In an email he summarizes the main results as follows:
1. Mortgage lending was 1/3 of bank balance sheets about 100 years ago, but in the postwar era mortgage lending has now risen to 2/3, and rapidly so in recent decades.
2. Credit buildup is predictive of financial crisis events, but in the postwar era it is mortgage lending that is the strongest predictor of this outcome.
3. Credit buildup in expansions is predictive of deeper recessions, but in the postwar era it is mortgage lending that is the strongest predictor of this outcome as well.
Here is VoxEU coverage of the work. On a related topic, here is a new paper by Rognlie, Shleifer, and Simsek (pdf), on the hangover theory of investment, part of which is applied to real estate. It has some Austrian overtones but the main argument is combined with the zero lower bound idea as well.
The credibility of the gold standard
There is a new published paper from Niall Ferguson and Moritz Schularick:
Abstract:
We ask whether developing countries reap credibility gains from submitting policy to a strict monetary rule. We look at the gold standard era, 1880-1914, to test whether adoption of a rule-based monetary framework such as the gold standard increased policy credibility, focusing on sixty independent and colonial borrowers in the London market. We challenge the traditional view that gold standard adherence was a credible commitment mechanism rewarded by financial markets with lower borrowing costs. We demonstrate that for the poor periphery – where policy credibility is a particularly acute problem – the market looked behind “the thin film of gold”.
Here is the published version, and here, here is an earlier version, all with varying degrees of gatedness.
For the pointer I thank Rob Raffety.