Month: September 2016
Thursday assorted links
1. “A law of conservation of violence” — through price effects.
2. Ten ways to adapt to prison.
4. “Sit with us” app avoids making loneliness common knowledge.
5. Densification has slowed down across the board.
6. There is lots of unrealized human potential (pdf), genetics study.
Globalization goes national
That is my latest Bloomberg column, and it address the common charge that globalization is over or has peaked. Global trade has in fact slowed down a great deal. But we are seeing a new kind of globalization, only inside the borders of the larger emerging economies, which often are not yet mature nation-states with complete economic integration. Here is one excerpt:
India also is seeing its different states and regions being tied together through migration, trade, and investment. You can see this in the food: tandoori chicken and dosas have become national standards, available throughout the country, and less closely associated with their particular regions of origin. Hindi is becoming more of a national lingua franca, and the Internet makes it possible to broadcast the same messages to the entire country at relatively low cost. Many these “globalizing” developments have spread expertise and capital from the more developed southern and western parts of India to the poorer eastern and landlocked regions. Labor, in turn, has migrated from the poorer states to the wealthier cities.
Significant barriers remain; for example, Indian trucks must pass through numerous checkpoints to carry goods around the country. Logistics costs remain high, at about 13 percent of gross domestic product. Fortunately, the recent move to a national goods-and-services tax will lower some of the state-level taxes on internal trade. Keep in mind that India’s most populous states would be among the larger nations in the world. So if Uttar Pradesh (over 200 million people) and Bihar (over 100 million people) have closer economic relations, it is a major advance in trade relations and resembles globalization in its economic consequences.
Here is the close:
But a lot of today’s globalization-by-any-other-name is, counterintuitively, taking the form of nation-building. And just as we got both good and bad sides of globalization, so will this process of nation-building be a mixed bag. It may, for example, sometimes include too much nationalism. Nonetheless, these stronger and better integrated political units probably will grow in wealth and economic sophistication, and in due time that will give us more globalization yet.
Much of the piece deals with China, do read the whole thing.
Anti-Surge Pricing

Charting Charts Chart

From Priceonomics which notes:
In our sample of Times pieces, we only found one chart used outside the Business section before 1990….By the late 2000s, charts had become central to the journalism at the Times. The newspaper had a team of graphics reporters infusing the paper with innovative visualizations. For the Times web edition, those data visualizations were often interactive.
…The New York Times cemented their prioritization of visual journalism when they launched the data-driven news site the Upshot in 2014. The Upshot’s original team of fifteen included three full-time graphic journalists.
Computers are the obvious driving factor. Data analysis and visualization are powerful tools. I would guess that data IQ has been increasing ala the Flynn effect.
How to boost employment
The Wi-Fi kiosks were designed to replace phone booths and allow users to consult maps, maybe check the weather or charge their phones. But they have also attracted people who linger for hours, sometimes drinking and doing drugs and, sometimes, boldly watching pornography on the sidewalks.
Now, yielding to complaints, the operators of the kiosks, LinkNYC network, are shutting off their internet browsers.
That is from Patrick McGheehan at the NYT.
Mexico fact of the day
Thus far, the only part of the currency universe that has responded consistently to the Trump phenomenon is the Mexican peso.
Not surprisingly, given the threat his policies pose to Mexican trade, Mr Trump’s poll fortunes have been inversely correlated to those of the peso. “That could stretch to a wider group of trade-sensitive currencies,” says Mr Juckes.
The peso has fallen almost 8 per cent against the dollar in the last six months, making it the worst-performing emerging market currency.
That is from Roger Blitz at the FT. Some of that movement of course may have come from the humiliation of the incumbent government, rather than the prospect of a Trump presidency per se.
And as the U.S. election becomes a tighter race, American equity prices do not seem massively perturbed. The worry from last week seemed to be more about Fed tightening than anything else.
A good sentence to ponder
Bach heard the St. Matthew Passion four times at most.
That is George Chien, from the September/October issue of Fanfare.
Is happiness inequality falling?
It seems so, at least subject to the usual caveats about happiness studies:
In spite of the great U-turn that saw income inequality rise in Western countries in the 1980s, happiness inequality has fallen in countries that have experienced income growth (but not in those that did not). Modern growth has reduced the share of both the “very unhappy” and the “perfectly happy”. Lower happiness inequality is found both between and within countries, and between and within individuals. Our cross-country regression results argue that the extension of various public goods helps to explain this greater happiness homogeneity. This new stylised fact arguably comes as a bonus to the Easterlin paradox, offering a somewhat brighter perspective for developing countries.
That is from a new paper by Clark AE1, Flèche S2, Senik C3. via Neuroskeptic. In other words, for the variable that really matters for welfarism, inequality is down not up. Shout it from the rooftops…
Wednesday assorted links
1. Free copy of Roger Paulin’s 662 pp. biography of August Wilhelm Schlegel, which received a very strong review from the TLS.
2. Explaining the cross-regional features of the Great Recession in the United States.
4. I can’t say I am convinced by this defense of Chomsky’s universal grammar.
5. Some basic economics of Wells Fargo.
6. A West Coast Straussian defense of Trump (no, not my view but the contrarian in me wishes to pass along some of the smarter people writing on this topic).
7. The secret stimulus: another fiscal failure.
Real median income rose 5.2%
That is great news of course. Do note however the following (NYT):
The median household income is still 1.6 percent lower than in 2007, before the recession. It also remains 2.4 percent lower than the all-time peak reached during the economic boom of the late 1990s.
Even with this unexpected and quite remarkable income gain, America is close to having gone twenty years without a significant money pay hike for its middle class category.
And do note this: two days ago, everyone was saying things felt OK but still sluggish, and they were citing mounds of evidence on behalf of this view. Maybe they still are right, don’t overreact to a single number. You don’t have to be a “negative Nellie” to think it doesn’t feel like a world of five percent wage growth.
As a separate point, note that essentially none of those income gains went to rural areas. That meant a 7.4% wage gain for larger cities — does the raise the import of the case for deregulating building?
Returning to the main story, I often hear it said that the wage stagnation problem is simply the result of a deep and debt-ridden recession. No doubt that is one factor, but it does not explain why the bad wage data go back to 1999-2000, before the real estate bubble much less the Great Recession. Something structural has gone badly wrong in the American economy, and let’s hope this data point stands as a major relevant sign in seeing its repair. I am not yet so optimistic, I am sorry to say.
Addendum: I was and still am agnostic on what and when the Fed should do next. But those of you who cite lack of rising wages as a good short-run indicator (not my view, by the way see the post directly below) of inflationary pressures — does this change your mind?
The macroeconomics of firing aversion
I am indebted to Bryan Caplan for developing and popularizing the idea of “firing aversion.” The core notion is that employers often do not wish to fire people for one of the same reasons they do not wish to cut nominal wages — it can demoralize their broader workforce. Furthermore, some bosses simply may feel squeamish about the idea of firing people they know and like.
In the old days, bosses might have enjoyed “busting heads” to keep all the workers in line, but in this softer millennial age, well firing aversion is the order of the day, if only to ease future recruitment and boost intangible capital and institutional continuity.
Now imagine a macroeconomy where firing aversion is present. At time period zero, a boss hires one hundred workers, who at the time are perceived as being of roughly equal quality and thus are offered the same wage. After a few years on the job, however, some are “keepers,” while others are being paid more than their marginal products.
Because of firing aversion, they are not fired. Because of sticky nominal wages, they also do not take a pay cut. If the economy is imperfectly competitive, and times are good, this nonetheless can be a stable equilibrium.
Now let’s say a negative shock comes along: demand, supply, maybe a bit of both, as is usually the case. At some margin these workers can no longer be carried and the firing aversion of the boss is overcome and they lose their jobs. Then, a few points:
1. They’re not getting those jobs back.
2. They’re not worth a comparable wage elsewhere in many cases.
3. Per hour productivity likely will rise, even adjusting for ex ante measures of changes in worker composition.
4. Companies won’t want to pay higher wages to lure these workers out of leisure, rather they are branded as less productive than average and properly so.
5. These workers will have to lower their wage expectations for the next job by an above-average amount. That is one reason why their reemployment may be slow. And they won’t re-enter the labor market at anything like their old wages.
6. As the economy returns to full employment, you won’t observe rising wages in the traditional sense because these workers are pulling in relatively low wages.
7. The more that Charles Murray is right in his Coming Apart, the stronger some of these effects will be. Yet none of it requires a “sudden attack of laziness.”
8. The more the employer can tell apart the quality of different workers, the slower the recovery will be and the less pro-cyclical wages will be. Arguably we have been seeing this difference at work since the G.H.W. Bush recession.
OK, now maybe you don’t buy firing aversion, fair enough. Just sub back in the traditional assumption that bosses study and scrutinize worker quality more in tough times, when revenue is tight, and you get essentially to the same place and the same conclusions as listed above. Firing aversion is simply one way of stylizing a pretty simple incentive effect, namely that the weaker workers have a better chance when cash is flush.
Addendum: How many blog posts have I read asserting “Since wages are not rising, etc., therefore various conclusions including lack of full employment, etc.”? Hundreds, I believe, mostly from the Keynesian bloggers. But in the data, real wages were never very cyclical in the first place. And in theory we should not expect much if any real wage cyclicality either. Most of all, the more employers can measure worker quality, the less cyclical real wages will be. And yes I know real wages just rose a lot (see the next blog post to come), if anything that is a sign recovery has been here for some time, not that finally recovery is arriving.
Don’t believe the good news about Brexit
That is my latest Bloomberg column. I perform some back of the envelope calculations to estimate very roughly that:
Nonetheless imports are almost 30 percent of British GDP, which you can take as one possible measure of what eventually might be spent on the outputs of foreign nations. So plausibly, in the long run that 30 percent becomes 10 percent more expensive because of the weaker British currency. Thirty percent of 12 trillion [national wealth] is 3.6 trillion, and the 10-percent value decline from that figure is 360 billion pounds, or about 5,625 pounds per capita. a pretty steep price for the Brexit vote.
To put that 360 billion pounds in context, that is about 19 percent of 2015 British GDP, much costlier than a typical recession. The bigger loss, however, is less psychologically painful because it is spread out over many years, basically the rate at which the British will spend down their wealth. And if you view the country as a wealth-generating mechanism for the future, in fact the actual costs will be higher because hitherto-unproduced wealth will be worth less too, although those costs are more distant yet.
This isn’t any kind of formal international trade model, with a full set of measurements and moving variables. It’s just a simple way of showing that the costs of Brexit can be high without a recession. It is quite possible and indeed likely that various adjustments, including a move away from foreign imports, would lower these costs. On the other side of the ledger, Brexit could help create a negative political and economic momentum that is not captured here either. Nonetheless this is a gross approximation of the first-order hit to British wealth.
Please let me stress again: I am not saying that is “the right number.” It is rather a simple exercise to show Brexit can have significant backloaded costs, without necessarily bringing a recession today. My conclusion is this:
The notion of a recession is actually a narrow way of thinking about economic cost, and it focuses attention too much on short-run, highly visible, and painful burdens. I worry that the spreading out of Brexit costs over time will lead the British people to feel invulnerable, to demand too much from their politicians, and to limit their ties with the EU too much and too quickly.
Do read the whole thing. And here is a good Francesco Guerrera piece on Brexit from Politico.
Revisiting the “elephant chart”
The elephant chart is the tool, developed by Branko Milanovic, often used to show that globalization has hurt the interests of much of the middle class, presumably due to competition with lower wage countries, most notably China. Now from the Resolution Foundation there is a new study of the matter, based in part on updated data from Milanovic, here are excerpts from Chris Giles and Shawn Donnan at the FT:
The Resolution Foundation found that faster population growth in emerging markets made it difficult to compare the incomes of the lower middle classes over time because their position in global income rankings changed. The larger number of Chinese families made it appear that the US poor were further up the global income scale in 2008 than they were in 1988.
If incomes were unchanged in every country, this population effect alone would lead to apparent drops of 25 per cent in parts of the global income scale associated with poorer people in rich countries. That generated the characteristic “elephant” shape, according to the Resolution Foundation.
These results were exacerbated by outlying factors, such as the former Soviet states of eastern Europe, which had incomes in the same zone and saw them collapse after the fall of communism.
Adjusting the chart for constant populations and removing China, ex-Soviet states and Japan shows a relatively even spread of income growth across the world. China is a clear outlier in performing very strongly.
“Globalisation is not to blame for all the ills of the world,” Torsten Bell, director of the Resolution Foundation, said.
Is it “elephant chart,” “elephant curve,” or “elephant graph”? I would stress two points. First, I am not sure the highly aggregated elephant “thing” was so useful to begin with, and indeed you will not see much of it in the MR archives. Second, there still may be significant cases where globalization has depressed or held down middle class wages. This is an important revision to how we organize the data, but maybe not a big revision to how we should think about the world.
Here is the actual report, go to Figure 10 on p.23 (this pdf), or try this link, the Resolution Foundation is on a roll these days.
Sentence of the Day–Infrastructure
Subsidizing Big Mac consumption would be a more effective way to provide jobs for the temporarily unemployed than subsidizing airport renovation.
From an excellent article on what infrastructure spending can and cannot do by Ed Glaeser.
Here’s another two:
Recovery Act transportation aid was twice as generous, on a per-capita basis, to the ten least dense states than it was to the ten densest states, even though higher-density areas need more expensive infrastructure (retrofitting New York with tunnels and bridges, for example, is far costlier than building in the greenfields of the West). Low-density areas are remarkably well-endowed with senators per capita, of course, and they unsurprisingly get a disproportionate share of spending from any nationwide program.
The multiplier just isn’t very large right now
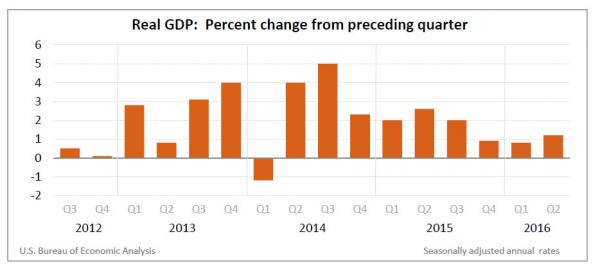
If the multiplier were large, more economic growth would beget yet more growth, but is that what you see for the post-2014 period?
You can think of this as another sign that aggregate demand policy has reached its limits. Advocates of large multipliers write as if government-sponsored economic activity will bring forth more activity yet. But “economic activity” – whether government-sponsored or not — has not been having a multiplicative effect since 2014 or arguably earlier yet.
I call this “The Multiplier for Me, but Not for Thee.” Favored policies are supposed to have large multipliers, but as for the growth we actually get, what kind of multiplier is that bringing? That’s not a question to be asked too many times because the answer will disappoint.