Category: Data Source
How is income inequality correlated with wealth inequality?
From the OECD, Kaja Bonesmo Frederiksen writes on “More income inequality and less growth” and presents this table:
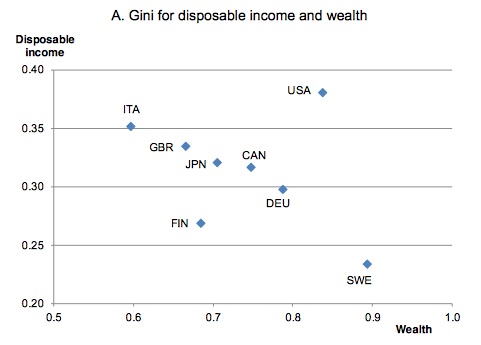
If you were to fit that with a curve, the overall slope would be negative, suggesting a negative empirical correlation between income inequality and wealth inequality. Now do not leap to a conclusion here, as there are points to be made:
1. This scatter plot is not based on a model with adjustments for confounding factors.
2. These may not be the right or best data on wealth inequality.
3. There are not many data points on this graph in the first place.
4. Lots of other stuff.
The point is that everyone is talking about wealth inequality lately, yet it is not always recognized that the relationship between wealth and income inequality is complex, as illustrated for instance by the case of Sweden. (There is nothing in this post by the way which should be construed as criticism of Piketty, I’m just trying to lay out some basic expository principles.)
Wealth inequality and income inequality may diverge for at least three reasons. First, savings rates may differ across societies. Second, locally available rates of return may differ. Third, the ups and downs of mobility may mean high income inequality in a given year but overall lower levels of wealth inequality.
By the way, here is a good sentence from the abstract:
Wealth dispersion [inequality] is especially high in the United States and Sweden
The support document is here, I have reproduced Figure 3a. Hat tip goes to Luis Pedro Coelho.
Sweden has lots of wealth inequality
Sweden is viewed as an egalitarian utopia by outsiders, but reality is complex. In some ways Sweden has less social equality than the United States. While the American upper class is largely meritocratic, the upper class in Sweden are still mostly defined by birth.
Historically, Sweden, Norway and Finland alone in Europe never developed Feudalism (Denmark was closer to continental Europe). The Nordic nobility was a small share of the population and not as powerful as the nobility in continental Europe, though still influential. The upper class in Sweden today consists of the nobility and of wealthy bourgeoisie families that socially merged with them. Wealthy bourgeois families live in the same neighborhoods and have adopted similar behavior and identity as the nobility. Despite long Social Democratic dominance they remain a coherent social group, with a distinct and recognizable accent, way of dressing, values etc.
Belonging to the upper-class is not defined merely by wealth, depending more on blood. Just as in historical times, a Nouveau riche member of the middle class will not automatically be accepted as a member of the upper-classes, unless they actively adapt their behavior and are accepted by the upper-classes socially.
The upper classes in Sweden retain a disproportional hold on wealth and power. The formal nobility in Sweden constitutes around 0.2% of the population. A couple of years ago I looked through the list of the wealthiest Swedes. Fully 10% of the richest Swedes are members of the nobility. By contrast not a single one of the richest Swedes was a non-European immigrant. Of Sweden’s prime-ministers Sweden during the modern era 20% belonged to the nobility.
Sweden is known for income equality. Increasingly, studies also point to Sweden as a country characterized by high intergenerational mobility of income. Income-distribution and wealth distribution are however not the same thing. What some may not know is that wealth-inequality is relatively high in Sweden. The top one percent own around 35% of wealth in the United States. In Sweden, because of extensive tax evasion, the number is harder to calculate. When including estimates of wealth held outside of Sweden, Roine and Waldenström estimate that the top one percent richest Swedes own 25-40% of total wealth, not far from American inequality levels, and increasing more rapidly.
At the same time, the intergenerational mobility of top wealth is chokingly low. A recent studyfound that a astonishing 80-90% of inequality of top wealth is transmitted to the next generation in Sweden!
According to one studythe share of the richest Swedes who inherited their wealth is around, 2/3 with 1/3 being entrepreneurs, while in the United States it was the opposite, with 1/3 of the wealthiest inherited their wealth while around 2/3 are entrepreneurs.
Thus while the Swedish middle class is large and has a compressed earning distribution, at the very top you have a small number of aristocratic families controlling much of the wealth. Mobility into this group is rare, probably rares than it is in the United States. One reason are stronger informal class-barriers, merely earning wealth is not enough to be accepted a member of the aristocratic upper-class. Another more interesting reason may be the unintended effect of welfare-state economic policies.
During the era of Social Democratic dominance, they wondered how to deal with wealth inequality. The dilemma facing the Social Democrats was this: The upper-class business families did a very good job managing Swedish export industry, the key to Sweden’s wealth. This is especially true for the Wallenberg family, the leading industrial family in Sweden, controlling amongst others ABB, Ericsson, Electrolux, Atlas Copco, SKF, AstraZeneca and Saab and doing an excellent job.
The Social Democrats decided to accept the unequal distribution of assets, but simply make these assets worth less using punitive high tax rates. Because of high inflation capital taxes were often 80-100%.
The upper-class families still owned most of private industry, but because of taxes those assets were simply not worth much. Paradoxically the high taxes and capital regulations which prevented foreign investments seem to have helped freeze the asset distribution into place, with the share of wealth owned by the rich being fairly constant between 1970 to the 1990s.
The OECD also reports that Sweden is quite unequal in wealth, hat tips go to Old Whig and Luis Pedro Coelho.
Piketty responds to critics
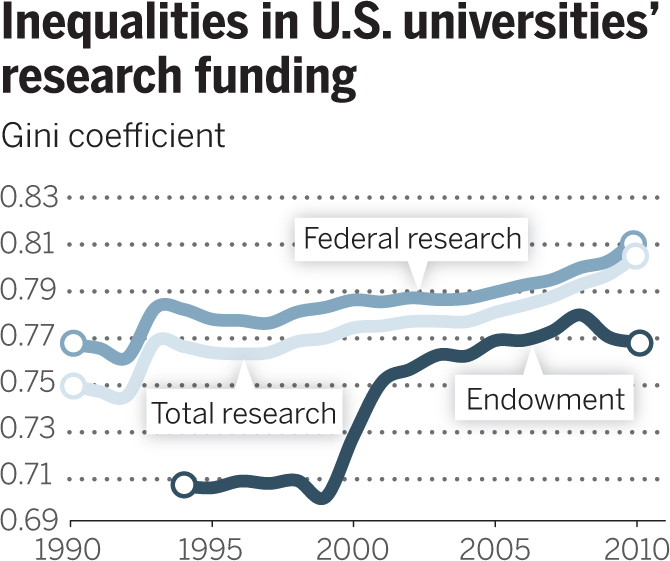
Gini coefficient for U.S. universities
For the pointer I thank J.O.
Very good sentences to ponder
“We all know that wealth inequality has gone up”
That is a response to the Piketty criticisms from Paul Krugman, and also mentioned by Matt Yglesias. Phiip Pilkington also has a useful treatment. This point however doesn’t do the trick as a defense. Keep in mind that the “new and improved numbers,” as produced by Chris Giles, are showing doubts about the course of measured wealth inequality in the UK. Maybe wealth inequality hasn’t gone up.
Now maybe that does “have to be wrong.” But if the “new and improved” numbers are wrong, it is hard to then argue Piketty’s wealth inequality numbers can be trusted. In which case we are back to knowing that income inequality has gone up, but not knowing so much concrete about wealth inequality. (That is one reason why my own Average is Over focuses on income, and on labor income in particular, because that is where the main action has been.) The data section of Piketty’s book, which has gathered so much praise, then is not so useful, though by no fault of Piketty’s. We might think it likely that wealth inequality has gone up, but if we are going to do these selective overrides of the best available data, we cannot trust the data so much period or otherwise cite it with authority. We also could not map wealth inequality into particular measures of the r vs. g gap at various periods of time.
If there is one big lesson of the FT/Piketty dust-up, it is that we don’t have reliable numbers on wealth inequality.
Now do we in fact “know” that wealth inequality has gone up? See this piece by Allison Schrager. Intuitions about wealth vs. income inequality are trickier than you might think. And on what we actually do and do not know, here is a very good comment on Mian and Sufi’s blog (for U.S. data):
What do the Piketty data problems really mean?
In some ways the new FT criticisms may not matter much, although I think not in a way which is reassuring for Piketty. There were already several major problems with Piketty’s analysis and also empirics, including what Alex has called the asset price problem. He wrote:
According to four French economists, Piketty’s measure of the capital stock is greatly influenced by the Europe-US housing bubble that preceded the financial crisis.
Adjusting for that factor seems to make the main results go away, and that is a purely empirical problem which has not been answered, at least not yet.
Another pre-existing empirical problem is that 19th century data seem to indicate that a “Piketty world,” even if we take it on its own terms, far from being a disaster, would likely be accompanied by rising real wages and declining consumption inequality, albeit rising wealth inequality.
That hasn’t been answered either, although a few people have suggested (without serious back-up) that if wealth inequality is going up that has to lead to political problems, or problems of some kind or another, and thus it can’t be something we can approve of or accept with equanimity, because inequality is really really bad, and therefore Piketty is somehow right anyway. That’s a weak response to begin with and furthermore it doesn’t fit the available data.
Empirically, inheritances aren’t nearly as important as Piketty seems to suggest.
On Twitter Clive Crook wrote of the:
…distance between treacherous data and super-bold conclusions an issue at the outset. This underlines the point.
Now, when you cut through the small stuff, the new empirical problem seems to be that UK revisions, combined with a population-weighted series for Europe, contradicts Piketty’s claim of rising wealth inequality for Europe. I would call that a serious problem. I am not impressed by the “downplaying” responses which focus on coding errors, Swedish data points, and the other small stuff. Let’s face up to the real (new) problem, namely that robustness suddenly seems much weaker. You can’t argue that population-weighting is “the right way to do it,” but it is an entirely plausible way to estimate the wealth inequality trend. If Piketty’s results don’t survive population weighting (and what are apparently the superior UK numbers), that suggests the overall rise in European wealth inequality is not very robust to how the pie is carved up and also that it is not backed by dominant, “rule the roost” sorts of forces.
It should be noted that Piketty’s response to the new criticisms was quite weak. Maybe he’s not to be blamed for what was surely a rapid and caught-off-guard response, and perhaps there is more to come, but it doesn’t reassure me either. He also should have run it by a PR person first (for instance, don’t start your response with a sentence ending in an exclamation point.)
That said, don’t focus on Piketty. When evaluating debates of this kind, never ever confuse a) is he right? with b) “how much should we raise/lower the relative status of the author as a result of the new exchange”? So responses like “he made all his data freely available,” or “he admits all along how complicated this all is,” address b) but not the more important a). And if you are seeing people focus on b) rather than a), they have a problem themselves. On empirical grounds it does seem we have another reason for thinking Piketty’s central claim isn’t quite right, at least not for the reasons he sets out, and perhaps not quite right altogether.
Addendum: Ryan Avent has a good survey of some key issues and responses.
Piketty update
…according to a Financial Times investigation, the rock-star French economist appears to have got his sums wrong.
The data underpinning Professor Piketty’s 577-page tome, which has dominated best-seller lists in recent weeks, contain a series of errors that skew his findings. The FT found mistakes and unexplained entries in his spreadsheets, similar to those which last year undermined the work on public debt and growth of Carmen Reinhart and Kenneth Rogoff.
The central theme of Prof Piketty’s work is that wealth inequalities are heading back up to levels last seen before the first world war. The investigation undercuts this claim, indicating there is little evidence in Prof Piketty’s original sources to bear out the thesis that an increasing share of total wealth is held by the richest few.
Prof Piketty, 43, provides detailed sourcing for his estimates of wealth inequality in Europe and the US over the past 200 years. In his spreadsheets, however, there are transcription errors from the original sources and incorrect formulas. It also appears that some of the data are cherry-picked or constructed without an original source.
For example, once the FT cleaned up and simplified the data, the European numbers do not show any tendency towards rising wealth inequality after 1970. An independent specialist in measuring inequality shared the FT’s concerns.
The full FT story is here.
Addendum: Here is the in-depth discussion. Here is Piketty’s response.
The inequality that matters
Brenda Cronin reports:
Recent hand-wringing about income inequality has focused on the gap between the top 1% and everyone else. A new paper argues that the more telling inequities exist among the 99%, primarily driven by education.
“The single-minded focus on the top 1% can be counterproductive given that the changes to the other 99% have been more economically significant,” says David Autor, a Massachusetts Institute of Technology economist and author of the study.
His paper, “Skills, Education and the Rise of Earnings Inequality Among the ‘Other 99 Percent’,” comes as something of riposte to French economist Thomas Piketty, whose bestselling “Capital in the 21st Century” has ignited sales and conversation around the world with its historical look at the fortunes of the top 1%.
Mr. Autor estimates that since the early 1980s, the earnings gap between workers with a high school degree and those with a college education has become four times greater than the shift in income during the same period to the very top from the 99%.
Between 1979 and 2012, the gap in median annual earnings between households of high-school educated workers and households with college-educated ones expanded from $30,298 to $58,249, or by roughly $28,000, Mr. Autor says. During the same period, he argues, 99% of households would have gained about $7,000 each, had they realized the amount of income that shifted during that time to the top 1%.
There is more here, including good graphs.
China Fact of the Day
In the course of making the case that China’s property bubble is popping the FT notes:
In just two years, from 2011 to 2012, China produced more cement than the US did in the entire 20th century, according to historical data from the US Geological Survey and China’s National Bureau of Statistics.
Can you trust Chinese government statistics?
Political scientist Jeremy Wallace has a recent paper on this topic:
Economic statistics dominate policy analyses, political discussions, and the study of political economy. Such statistics inform citizens on general conditions while central leaders also use them to evaluate local officials. Are economic data systematically manipulated? After establishing discrepancies in economic data series across regime types cross-nationally, I dive into sub-national growth data in China. This paper leverages variation in the likelihood of manipulation over two dimensions, arguing that politically sensitive data are more likely to be manipulated at politically sensitive times. GDP releases generate headlines, while highly correlated electricity production and consumption data are less closely watched. At the sub-national level in China, the difference between GDP and electricity growth increases in years with leadership turnover, consistent with juking the stats for political reasons. The analysis points to the political role of information and the limits of non-electoral accountability mechanisms in authoritarian regimes as well as suggesting caution in the use of politically sensitive official economic statistics.
All good points. I would stress, however, that Chinese statistics have many problems in them and so they are not simple overestimates of how the economy is doing, at least not over the last thirty years as a whole. In some ways Chinese growth statistics have been, until 2008-2009, probably underestimating the actual progress on the ground. In general, growth figures underestimate progress when changes are large, and overestimate progress when changes are small. (One reason for this is that extreme progress brings a lot of new goods to the market and their marginal value is underestimated by their price ex post, since it is hard to adjust for the fact that the price ex ante was infinite or very high.) In Western history for instance, our most significant period of growth was probably the late 19th through early 20th century, when the foundations for the modern world were laid, yet estimated growth rates for this period are not astonishingly high. We’re missing out on the values of the new goods, for one thing.
For the pointer I thank Henry Farrell.
Dynamic effects of microcredit in Bangladesh
By Khandker and Samad, there is now a new study of microcredit and it has a much longer time horizon — twenty years — than the previous “gold standard” studies. It also finds more positive effects than many of the other treatments:
This paper uses long panel survey data spanning over 20 years to study the effects of microcredit programs in Bangladesh. It uses a dynamic panel model to address a number of issues, such as whether credit effects are declining over time, whether market saturation and village diseconomies are taking place, and whether multiple program membership, which is rising as a consequence of microcredit expansion, is harming or benefiting the borrowers. The paper makes the following observations:
- Group-based credit programs have significant positive effects in raising household welfare including per capita consumption, household non-land assets and net worth;
- Microfinance increases income and expenditure, the labor supply of males and females, non-land asset and net worth as well as boys’ and girls’ schooling;
- Microfinance, especially female credit, reduces poverty;
- Past credit has a higher impact on income and expenditure than current credit;
- With higher village-level aggregate current male borrowing, the marginal effect of male borrowing on per capita income gets lower.
The paper concludes that the current microfinance policy of credit expansion alone may not be enough to boost income and productivity, and, hence, sustained poverty reduction.
There is a useful write-up of the paper from The Economist. In sum, we should up our estimate of the efficacy of microcredit.
Chinese wheat eaters vs. rice eaters (speculative)
Angela Meng reports:
Researchers have found that people from rice-growing southern China are more interdependent and holistic thinkers, while those from the wheat-growing north are more independent and analytical.
The researchers call it “rice theory”, and they believe the psychological differences of southern and northern Chinese stem from their ancestors’ subsistence techniques – rice farming needs co-operation and planning; wheat farming requires less co-operation between neighbours.
…The last experiment assessed the nepotism, or group loyalty, of the participants. Students were given hypothetical scenarios and asked how they would treat friends and strangers in reaction to helpful or harmful actions. A defining characteristic of holistic culture is that people draw sharp contrasts between friend and stranger.
“The data suggests that legacies of farming are continuing to affect people,” Thomas Talhelm, of the University of Virginia and lead author of the research, said. “It has resulted in two distinct cultural psychologies that mirror the differences between East Asia and the West.”
Talhelm and his team concluded that the co-operative nature of rice-growing has cultivated a culture of interdependence, while wheat-growing has cultivated independence.
“I think the rice theory provides some insight to why the rice-growing regions of East Asia are less individualistic than the Western world or northern China, even with their wealth and modernisation,” Talhelm said.
Here is Talhelm’s home page. Research summaries are here (interesting). Links to his research are here, and the wheat paper is here.
For the pointer I thank the excellent Mark Thorson.
The Piketty Bubble?
Piketty’s Capital is not very clear on how to distinguish greater physical capital from higher asset prices. For the most part, Piketty discusses capital as something that builds up over time through savings. The increase in physical capital then generates large returns to rentiers and those returns increases the capital share of income. When it comes to measuring capital, however, this has to be done in money terms which means that we need the price of capital. But the price of capital can vary significantly; as a result, Piketty’s capital stock can vary significantly even without changes in physical capital or savings. When capital increases because of changes in its price, however, the implications are quite different from a physical increase in capital.
Consider an asset that pays a dividend D forever; at interest rate r the asset is worth P=D/r. As r falls, the price of the asset rises. An asset that pays $100 forever is worth $1000 at an interest rate of 10% (.1) but $2000 at an interest rate of 5%. Piketty measures a higher P as more capital but notice that P is high only because r is low. You can’t, therefore, multiply P by some fixed r and conclude that rents have increased. Indeed, in this case rents, the dividend, haven’t increased at all. For the most part, Piketty simply ignores this issue (at least in the book) by arguing that changes in the price of capital wash out over long time periods but that does not appear to be the case in his data.
According to four French economists, Piketty’s measure of the capital stock is greatly influenced by the Europe-US housing bubble that preceded the financial crisis (Tyler earlier pointed to the French version of this paper, this is the English version). Since Piketty’s theory is based on rents from physical capital, the authors suggest that measures of housing capital based on prices should be corrected using the rent to price ratio. In other words, if the rentiers aren’t getting more rents then their capital hasn’t really increased. When measured in this way, the authors find little to no increase in the capital stock in either France or the United States.
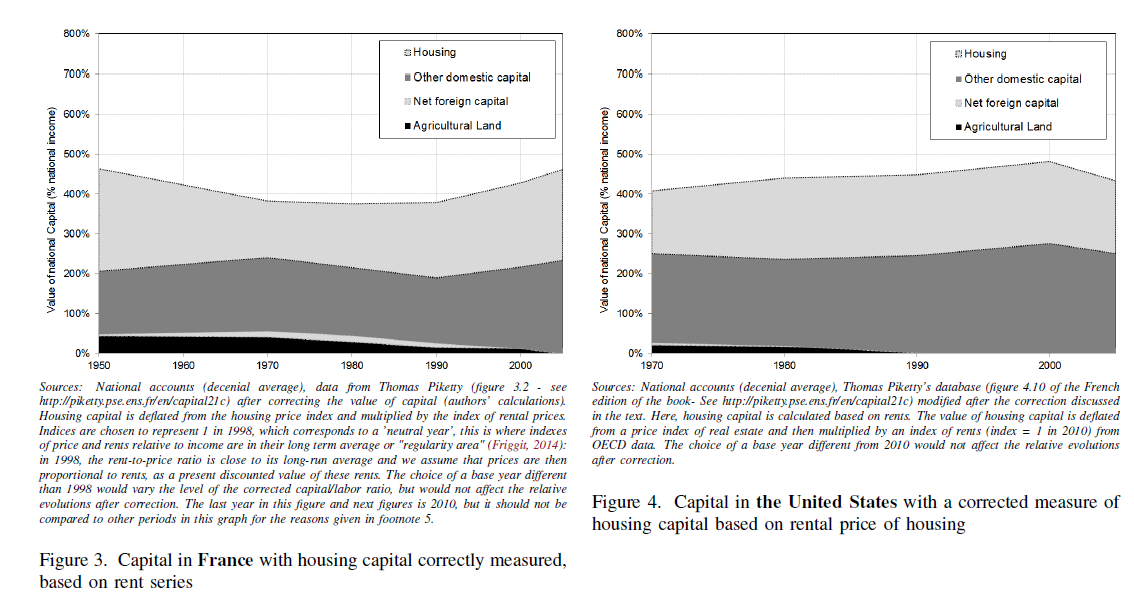
Addendum: Do note that the debate here is not about income inequality but rather the source of income inequality and the implications for the future that Piketty draws from a (possibly not) rising capital stock.
How many World Bank reports are downloaded or cited at all?
About 13 percent of policy reports were downloaded at least 250 times while more than 31 percent of policy reports are never downloaded. Almost 87 percent of policy reports were never cited. More expensive, complex, multi-sector, core diagnostics reports on middle-income countries with larger populations tend to be downloaded more frequently. Multi-sector reports also tend to be cited more frequently. Internal knowledge sharing matters as cross support provided by the World Bank’s Research Department consistently increases downloads and citations.
By the way, about 49 percent of these reports have the stated objective of informing the public debate. There is more here, from the World Bank itself, by Doerte Doemeland and James Trevino.
A prediction: from MR alone, this will be one of the Bank’s most widely downloaded reports.
Hat tip goes to Justin Sandefur.
I could not have said it better myself.