Results for “average is over” 1569 found
Tyrone on why the government shutdown and the debt ceiling crisis were brilliant Republican strategy
Tyrone, my evil twin brother, was in town visiting the other day, after a long absence. He was upset that I gave so little space to the recent machinations in Washington, and that I assigned the events so little importance, so he asked if he could offer his own coverage in a guest post. Since Tyrone is occasionally a lunch guest of ours, against my better judgment I said yes, so here is my dictation of his midnight sermon:
Tyrone: I read what a strategic disaster the fracas has been for the Republican Party and for the Tea Party movement in particular, but I don’t see it. Where I grew up, this counts as a successful stare-down. Most of the time, the pit bull does not in fact lunge for your throat, but it is hardly a mistake for him to snarl, even if that raises his borrowing rates.
Look where we stand. In real terms government spending has been falling. Sequestration appears to be permanent, or it will be negotiated away by Republicans in return for preferred changes in tax and spending policy. Leading Democratic intellectuals are talking about future fiscal bargains with no new taxes. The American public polls as increasingly conservative.
With this sequence of events, combined with 2011, the Republicans convinced some of their opponents that they are crazy and irresponsible, without actually being crazy (though they were irresponsible, but that is the whole point). I peaked once into Tyler’s Twitter feed, and I found several accomplished Democratic economists — yes brilliant economists, as all economists are — suggesting that any day now markets are going to notice the truly crazy character of the Republican House and price that into interest rates and stocks. Oh what a tale! (A more accurate reading of the more radical Republicans would in fact be more cynical and ordinary than most of the pablum served up by their critics.) Imagine that you control only the House and can manage to convince your opponents that you are stronger and more dedicated to your cause than in fact you are. Only the truly strong and dedicated can pull such a caper off!
Someday, if the Democrats wanted to raise the exemption level for the payroll tax, and pull in a lot of new revenue, what kind of opposition could they expect? Probably they will shy away from that battle altogether, for fear of another Ted Cruz filibuster.
Yes, Virginia (literally), protecting the brand does sometimes mean going down with the ship.
In the longer run the Republicans will have changed the Doug Overton window on most of these issues. (Tyler interjects: My apologies loyal MR readers, Tyrone has no Ph.d., not even a Masters, and thus he misuses terminology as would a mere child.) Even if most Americans do not agree, it is now considered common to believe and to argue publicly that Obamacare represents the end of freedom in our time. If Obamacare turns out to fail in the eyes of the public, that condemnatory view is being held in the back of people’s minds, whether they admit it or not, whether they agree or not. They will start to agree more and more, the less generous their Medicare benefits look as time passes. The future counterrevolution in redistribution is going to have to come from somewhere and it is a major victory to cement the word “Obamacare” as a hypostatized “thingie” in people’s minds, for future reference.
The Republican tactics understand the importance of skewed pay-offs. In an age of political gridlock, the goal is not to maximize the expected value of your image, any more than you would do the same on a date. Rather the goal is to maximize the chances of moving your agenda forward, conditional on the existence of world-states where that might be possible. The harder it is to pull off change, the stupider your strategy will look in most world-states, but hey that is the price of admission to this game. Capital is to be periodically run down, and if in politics, as in management more generally, if you always look good you are doing something badly wrong.
Another fallacy is that no DC crisis would have focused more attention on the failings of the Obamacare exchanges in a useful manner. People, that is small potatoes. No one is going to repeal or even modify ACA because of a few weeks’ bad publicity at the opening. (Recall the Medicare prescription drug bill, which took weeks to get off the ground but now is beloved and is part of the permanent furniture of the universe, like Supersymmetry or quantum gravity.) If Obamacare is really going to do poorly, it is better if we build up high or least modest expectations for it. Imagine the Christmas present of learning you don’t really have insurance coverage after all. Or the New Year’s resolution that after you have been billed three times for the same policy, you vow to pay for only one of them and live with the bad credit rating until it gets straightened out. How about extreme adverse selection into the exchanges, resulting in 50-100% premium hikes in the first year of operations? (The lower premia are now, the better! Bread, peace, land! Ach du grüne Neune!) That’s what will get further traction for the Tea Party on Obamacare, not a bunch of bad reviews on opening day, as if the policy were no more than a mid-tier Jennifer Aniston movie (I can no longer refer to Sandra Bullock in this context), to be swatted down by mild tut-tuts of disapproval and inconvenience.
The very best victories are often described as ignominious retreats.
Tyler again: Readers, I am sorry to subject you to such rants. But Tyrone insisted. In fact he threatened that, if I did not comply with his request, he would write a lengthy review of Average is Over, for which outlet I am not sure, perhaps an average outlet. He threatened to shutter our common household. He prophesied that cats would lie down with dogs. He even threatened to default on our joint credit card bill, ruining my credit rating forever. And people, you now all know just how powerful such threats can be.
How much is African poverty really declining?
I’ve never been convinced by extant treatments of this topic. Here is one further stab at the problem, from Afrobarometer (pdf):
New data from Round 5 of the Afrobarometer, collected across an unprecedented 34 African countries between October 2011 and June 2013, demonstrates that lived poverty remains pervasive across the continent. This data, based on the views and experiences of ordinary citizens, counters projections of declining poverty rates that have been derived from official GDP growth rates. For the 16 countries where these questions have been asked over the past decade, we find little evidence for systematic reduction of lived poverty despite average GDP growth rates of 4.8% per year over the same period. While we do see reductions in five countries (Cape Verde, Ghana, Malawi, Zambia and Zimbabwe), we also find increases in lived poverty in five other (Botswana, Mali, Senegal, South Africa and Tanzania). Overall, then, despite high reported growth rates, lived poverty at the grassroots remains little changed. This suggests either that growth is occurring, but that its effects are not trickling down to the poorest citizens in fact, income inequality may be worsening), or alternatively, that actual growth rates may not match up to those being reported. The evidence also suggests, however,that investment in infrastructure and social services are strongly linked with lower levels of lived poverty.
I am not suggesting that these are “the right” numbers, and you might object that they are based on individual responses to questions. Still, the numbers do show a very definite poverty reduction in the case of Ghana and some other countries with good news, so the responses do not seem entirely unconnected to reality. In any case I have long been suspicious about how much African growth has been resource-generated rather than based in ongoing gains in agricultural productivity.
If you would like better news from Africa, here are some figures from last year about declining child mortality. Here are some new results comparing Africa to earlier stages in British history, the original paper is here (pdf).
The economic recovery that is America
Averaged across all occupations, we estimate that real median wages declined by 2.8 percent from 2009 to 2012. This is a striking decline, given that productivity increased by 4.5 percent over this same time period….Moreover, as shown in Figure 1, lower-wage and mid-wage occupations saw significantly bigger declines in their real wages than did higher-wage occupations. Occupations in the top two quintiles saw their median wages decline by less than 2 percent on average (and nearly a third of those occupations actually saw real wage growth). By contrast, occupations in the bottom three quintiles saw their median wages decline by 3 percent or more.
That is from a recent National Employment Law Project study, discussed by Kevin Drum here, Felix Salmon too.
The unilateral extension of trade credit to the Italian government
An ongoing issue is that the government is simply delaying payments to private suppliers:
Beppe Grillo, leader of the opposition 5-Star Movement, has long hammered on this point. In April, during the post-election interregnum, he’d clamored for “the immediate payment of about €120 billion” that the government and public entities owed the private sector.
The government’s refusal to pay its suppliers violates EU rules. But the EU has soft-pedaled the issue, for two very big reasons: payment of arrears would force Italy to sell a truckload of bonds when there might not be any demand; and it would push the deficit way beyond the 3% line in the sand. Thanks to cash accounting, only actual disbursements make it into the deficit figure. Italy has achieved its “austerity” goals by not paying its suppliers.
There is also this:
…[government] expenditures rose 1.3% in the first quarter, while revenues remained flat.
You can read more here, hat tip Fabrizio Goria. Right now the Italian state is taking an average of about six months to settle private bills, longest in the EU. You can think of these delayed payments as a form of anti-stimulus of course.
What is the most perfectly average place in the United States and why?
That is a question from Annie Lowrey, who recognizes its (supposed) “extreme folly.”
I’ve thought about this for years, and always Knoxville, Tennessee comes to mind. Knoxville is big enough to be something, but not a truly large metropolis, being only the third largest city in Tennessee. It is educated enough to avoid some of the more stereotypical features of the South and indeed it was recently named the #2 “reading city” in America. It has elements of the South and of Appalachia, two major regions of the country. Eleven percent of Knox County adults are “binge drinkers.” It is not one of “12 American boomtowns.”
What else in America might be typical?
Here are nominations of Muncie, Indiana and Kansas City, MO.
Ethnically speaking, Wichita Falls is close to the national norm.
According to this article, high poverty and unemployment are wrecking the averageness of Peoria, Illinois.
Louisville is not a bad pick.
Obviously we must rule out NY, CA, TX, and probably any coastal state as well. I can see the virtues of selecting a Kansas City suburb, which picks up elements of both the South and the Midwest, but I fear that is in a way too typical. The most average place in the United States is in fact just a bit off and has some flavor of its own and choosing Knoxville picks up that too.
Addendum: Matt Yglesias selects Jacksonville, Florida. Kevin Drum cites marketers in favor of Albany, NY.
Overall health inequality seems to be down
The haves are those who enjoy great health into their 90s. The have-nots are those who suffer from serious health problems and do not live to see adulthood. As we pointed out in a recent study, among those Americans who were born in 1975, the unluckiest 1 percent died in infancy, while the luckiest 1 percent can expect to live to age 105 or longer. Now let’s fast forward to those born in 2012. The bottom percentile of this cohort can expect to survive until age 18. At the other end of the spectrum, the luckiest 1 percent can expect to live to age 108. That’s a much bigger gain in life expectancy among the have-nots than among the haves. Of course, life expectancy is but one measure of health and well-being, but understanding these trends offers a more complete picture than considering income alone.
These findings run counter to headlines noting a widening gap in health outcomes between different demographic groups. For example, a study led by Jay Olshansky of the University of Illinois at Chicago recently demonstrated that the gap in life expectancy between less educated and more educated Americans has widened considerably.
While studies like these are valuable in highlighting disparities between socio-economic groups, they do not tell us much about overall health inequality. That’s because most health inequality occurs within groups. In other words, if we look at a particular demographic group, the best outcomes for people in that group are dramatically different from the worst outcomes for people in the same group. These differences overwhelm any differences in average life expectancy across demographic groups. Thus, while inequality across some demographic groups has increased, it has fallen over the entire population. Overall, therefore, the health have-nots have made progress in catching up to the health haves.
That is from Benjamin Ho and Sita Nataraj Slavov. I am open to counters on the data side, but so far this seems both a) true and b) rooftop-worthy. I am reminded of Arnold Kling’s three axes of ideology; perhaps health care inequality attracts attention only when the victims are a group (the poor) who are part of some other narrative of oppression.
The overtime boom
The last time U.S. factory workers put in longer weeks than they averaged in February, Rosie the Riveter was on the assembly line and American GIs were fighting Nazis in Europe.
All those extra hours helped to drive five straight months of manufacturing growth in the U.S., racking up 52,000 new factory jobs, according to Labor Department data. That includes 14,000 positions in February alone.
Good news of course, but there is a dark lining to the cloud. I take the heavy reliance on overtime to be another sign of labor market polarization, and of low employer demand for a large number of the unemployed.
The story is here, hat tip goes to this chain.
Addendum: As Matt Yglesias reports, retail sales are strongly up too.
Average earnings of young college graduates are still falling
Alas, take a look:
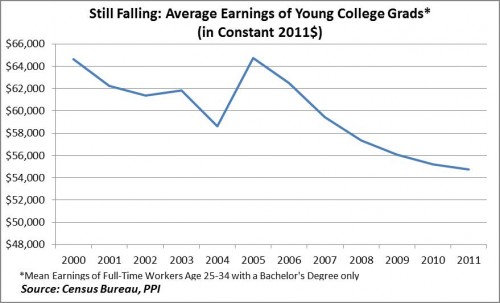
Diana G. Carew, who works with Michael Mandel, reports:
The latest Census figures show real earnings for young college grads fell again in 2011. This makes the sixth straight year of declining real earnings for young college grads, defined as full-time workers aged 25-34 with a bachelor’s only. All told, real average earnings for young grads have fallen by over 15% since 2000, or by about $10,000 in constant 2011 dollars.
That picture is the single biggest reason why higher education in this country is in economic trouble as a sector. And yes, I do understand that the “education premium” is robust, but that means wages for non-college workers have been hurting as well. At some margin, when it comes to determining how much you will pay for college, the absolute return matters too. The full article is here.
The New Republic covers MRU
I very much enjoyed this new article by Marc Tracy. (The site is now up! And if we haven’t processed your registration yet it is because we are swamped with numbers, our apologies, please bear with us.) Excerpt:
The videos, several of which were made available to me, are indeed more friendly than the stuff you typically find on Coursera, if not as viscerally captivating as, say, a TED talk. Manufactured with Microsoft PowerPoint and a $4 iPad app, they tend to last in the neighborhood of five to eight minutes—Cowen, who possesses a parody of an economist’s precision, noted on his blog, “The average video is five minutes, twenty-eight seconds long”—with segments frequently summarizing and highlighting the most interesting parts of academic papers (“Seasonal Food Prices and Policy Responses: A Narrative Account of Three Food Security Crises in Malawi”); these papers are duly credited and usually available online for free.
Narrated by Cowen or Tabarrok, the videos share the curiosity, eclectic interests, and tongue-in-cheek dryness of the blog. For example, Cowen riffs off a paper that showed that when cable television was introduced to several Indian villages, the fertility rate fell. He intones, in a studied deadpan reminiscent of Alfred Hitchcock’s belabored enunciation: “We don’t know, however, whether this is because women or families have better information about birth control, or simply that they’re exposed to alternative visions of different lifestyles on TV, and maybe want to spend their time in ways other than just having more children.”
How much would a personal poverty coach help the poor?
There is a new experiment being run in Haiti:
Would a personal assistant help? An experiment here may answer that.
Half of the commune’s 10,000 households are being assigned a “household development agent” — a neighbour who will work as a health educator, vaccinator, epidemiologist, financial analyst, social worker, scheduler and advocate all at the same time. With the agent’s help, a family will assess its needs and come up with a plan to make things better.
“The idea is to forge a relationship from the get-go,” said Maryanne Sharp, an official at the World Bank, which is overseeing the $4 million project. “We want the family to say, ‘Yes, we own the plan and we will work on these objectives on this timetable.’ “
The other 5,000 households will function as a control group, continuing as they have, scrounging out a living in one of Haiti’s poorest and most isolated places.
In two years, the families will be resurveyed and their children and houses re-examined. If those with agents are doing better, then the strategy of coaching people out of poverty may be expanded to the whole country.
I would like to see a third group, which receives cash instead of the assistant or nothing. By the way, the coaches have received extensive training:
They spent multiple week-long stays in the nearby town of Hinche learning what a vaccine does, how to calculate a dosage and how to give an injection. They learned about ways to purify water and get a micro-finance loan. They learned how to raise consciousness, even as theirs was being raised.
Still, on average they have a 9th grade education. The coaches also receive bonuses for doing a good job, such as measured by the number of child vaccinations. Another version of the link is here, with photos.
Government size and economic growth
I thought the new paper by Andreas Bergh and Magnus Henrekson was both useful and wise:
The literature on the relationship between the size of government and economic growth is full of seemingly contradictory findings. This conflict is largely explained by variations in definitions and the countries studied. An alternative approach – of limiting the focus to studies of the relationship in rich countries, measuring government size as total taxes or total expenditure relative to GDP and relying on panel data estimations with variation over time – reveals a more consistent picture. The most recent studies find a significant negative correlation: An increase in government size by 10 percentage points is associated with a 0.5 to 1 percent lower annual growth rate. We discuss efforts to make sense of this correlation, and note several pitfalls involved in giving it a causal interpretation. Against this background, we discuss two explanations of why several countries with high taxes seem able to enjoy above average growth: (i) that countries with higher social trust levels are able to develop larger government sectors without harming the economy, and (ii) that countries with large governments compensate for high taxes and spending by implementing market-friendly policies in other areas. Both explanations are supported by current research.
That is the working paper version, there is a published and gated version in Journal of Economic Surveys. By the way, here is a new video on economic freedom.
The ongoing German recovery
Here is the latest:
Factory orders in Germany, Europe’s largest economy, unexpectedly increased in May, led by domestic demand for investment goods such as machinery.
Orders, adjusted for seasonal swings and inflation, increased 1.8 percent from April, when they surged a revised 2.9 percent, the Economy Ministry in Berlin said in a statement today. Economists had forecast a drop of 0.5 percent, according to the median of 33 estimates in a Bloomberg News survey. In the year, orders rose 12.2 percent, when adjusted for work days.
That is a funny result for a country committed to a near-balanced budget by 2016 and it shows the continuing importance of real factors for economic recovery. Mind you, this may well end badly, but for broader European reasons, or perhaps because of problems from the Chinese economy.
From Michael Burda and Jennifer Hunt, here is a very useful paper (newer, better, and gated version here) on why German labor markets have done so well in the Great Recession:
Germany experienced an even deeper fall in GDP in the Great Recession than the United States, with little employment loss. Employers’ reticence to hire in the preceding expansion, associated in part with a lack of confidence it would last, contributed to an employment shortfall equivalent to 40 percent of the missing employment decline in the recession. Another 20 percent may be explained by wage moderation. A third important element was the widespread adoption of working time accounts, which permit employers to avoid overtime pay if hours per worker average to standard hours over a window of time. We find that this provided disincentives for employers to lay off workers in the downturn. Although the overall cuts in hours per worker were consistent with the severity of the Great Recession, reduction of working time account balances substituted for traditional government-sponsored short-time work.
I would add one factor. Germany didn’t have much of a real estate bubble and the Great Recession arrived on its shores, in part, through export markets. Global export markets collapsed quite rapidly, but they also recovered fairly rapidly (ask Singapore, and here). That made the German recovery easier. It also helped their labor market policies. Germany didn’t encounter much of a “recalculation.” Demand went and then demand, for more or less the same things, came back. The political strategy of “freezing” the jobs and trying to preserve the informational capital in those relationships was set up to work fairly well, which it did.
Does mismeasured inflation overturn a relative stagnation thesis?
In the comments, Slocum writes:
My skepticism is not that the nominal household income or GDP number are wrong, but that the inflation-adjusted numbers are wildly off because they fail to capture the innovations and transformational improvements in goods and services. Consider music. The music industry, measured in sales, is shrinking. 25 years ago as a college student, I bought a lot LPs and CDs (probably a few hundred $$ a year). Now I spend very little. Am I worse off as a music listener now? Obviously not — I am immensely better off. But judging by the gross dollar volume of the music business, you would reach exactly the wrong conclusion about 'stagnation'.
The fundamental fact is that U.S. real median income has risen at a lower rate since 1973, not that progress has been absent. One might think that the CPI is skewed and there are reasonable arguments to be made in this direction. But the CPI will be most skewed to underappreciate progress when truly new goods and services are being introduced into the marketplace or spreading to new regions. And that is (roughly) the 1870-1950 period, more than any other time. In other words, if you account for CPI bias, the slowdown in median income growth — the difference — is probably larger than the numbers make it appear, even though in absolute terms both growth rates will be higher than measured.
When some people hear the relative stagnation thesis, their minds shoot to various bogeymen: Paul Ehrlich, ridiculous 1907 proposals to close the patent office, predictions of mass starvation, and so on. The simplest version of the point is that technological progress is not uniform, and that is borne out by thousands of years of human history. This isn't Lake Wobegon, so some periods have to have lower than average growth in living standards than other periods. One of those periods happens to be now, since 1973, give or take. And from that flows many propositions of importance, for politics too.
You can buy the eBook here.
Has a potentially habitable planet just been discovered?
Should government be spending more when real interest rates are low?
Let's look again at Brad DeLong on fiscal policy:
The U.S. Treasury can borrow for thirty years, taking all CPI risk onto its own books, and pay only 1.83% per year in interest?
Wow.
Ahem.
It's not just that a greater amount of government investment meets the benefit-cost test when the government can borrow at 1.83% in inflation-proof bonds for thirty years, a whole bunch of tax postponements do as well. And so do a whole bunch of expanded social welfare programs. And so do a whole bunch of government issues of debt which are then invested in risky private ventures.
…the cost of borrowing for the government has fallen–the market value today of future cash tax flow earmarked for debt repayment has gone way, way up–therefore we should dedicate more future cash flow to debt repayment by borrowing more. There is no "but even." Expansionary fiscal policy is a good idea,
To explain why I view it differently, let's start with a parable from the private sector. Managers in large corporations often are given project "hurdle rates" of twenty to thirty percent, not because their cost of capital is so high, but because of agency problems. If the manager were given a hurdle rate of eight percent, he or she might go crazy with new projects and the company would too easily meet its ruin. It then follows that changes in the actual cost of capital, within moderate ranges, don't so much influence private investment and in this second or third best sense shouldn't. If the hurdle rate is thirty percent, and the cost of capital falls from ten to seven percent for a business, that maybe looks like a big change but actually it's a change in a largely non-binding constraint.
All that is standard and it has long been stressed by Joseph Stiglitz, among others. Furthermore in regressions the cost of capital often fares poorly in predicting private sector investment and that is one reason why. I don't regard the above as "proven" but it does seem to be "likely."
Now let's turn back to the government. Pre-crash, it already could borrow at low real rates of interest. And there already were unexploited public sector projects with high potential rates of return. But we don't want our government to go crazy, spending money without limit. There are agency problems and a lot of the money ends up spent poorly. We instead wish to impose a hurdle rate on government projects. Let's say we trust our government more than shareholders trust private sector managers. That could mean a government project hurdle rate of, say, fifteen percent, which would be below the typical private sector hurdle rate. I'm being generous in that comparison of course; note that mistaken private sector projects get reversed more easily, through bankruptcy, than governmental mistakes do.
OK, there's a hurdle rate of fifteen percent and the cost of capital to government falls from three percent to one percent. How much does it matter? Should it matter? The hurdle rate — the most binding constraint — hasn't changed.
There are many ways of complicating and modifying this model, and I am not saying that the correct "elasticity of projects," with regard to the real interest rate should be zero. Still, I think this model explains why I am less impressed with the real interest rate changes than is Brad.
There is the separate — and very important issue — of covering for the worst-case scenarios. This is stressed, correctly, in analyses of global warming but it matters in fiscal policy too.
One could make the quite different argument that we today have a better administration than average and that therefore the hurdle rate should be lower and government spending should be higher. Now is not the time or place to evaluate such claims, but in terms of logic that to me is a stronger argument than citing the real interest rate effect. It focuses on the most binding constraint, namely the hurdle rate stemming from the agency problems. At the same time, it is an argument for higher spending with or without Keynesian factors or unemployed resources playing a major role. It's the common sense point that a more competent manager should undertake more tasks.