Results for “model this” 3181 found
A simple model of Putin and the Ukraine crisis
I think the correct model here is “Putin has put down so many chips, he can’t walk away with nothing. He wants to wreck Ukraine (more than taking territory per se). He will do the minimum amount he can that leaves him with a strong probability of having wrecked Ukraine, and no more.”
That still leaves a broad range of possible outcomes, but at the moment that is my mental model for updating with new information.
Modeling Vladimir Putin
That is the subject of my latest Bloomberg column, here is one excerpt:
Economists typically define rationality as the effective use of means to achieve ends — spending your money for maximum enjoyment, for example. That is fine for some purposes, but it fails when it comes to understanding those political leaders, Putin included, who are obsessed with power.
The economic framework doesn’t work well when power is the end itself. While no one can truly know what’s in the mind of Putin, he has ruled Russia for 22 years, a pretty good sign that he cares about power. Putin also grew up in an era — as a KGB agent behind the Iron Curtain — when power was the currency of status.
So how does the quest for power make Putin difficult to deter?
Deterrence, by its nature, attempts to limit the power of the deterred person. If a person cares about many things, not just power, they will respond to deterrence by seeking less power and spending more on other things, such as quiet contemplation or time with family. If a person cares mainly about power, however, the induced response to deterrence is to try to seize back more power.
In other words, trying to make power “more expensive” for Putin is not guaranteed to work. The price of enjoying power might go up — say, because of threatened sanctions — but the thirst for renewed power goes up too, precisely because some power has been taken away.
Deterrence does not always work in international affairs, or in other situations with power-mad individuals. Napoleon and Hitler faced high costs from their blunders, but still they proceeded with ambitious and ultimately foolish military plans. Many revolutionaries try to seize power and die doing so.
…It is a common economic trope to insist that “incentives matter.” While true, it does not necessarily follow that deterrence therefore works. Putin isn’t looking to retire and spend more time on one of his luxurious yachts. The full consequences of that fact are just now becoming clear.
Note that as a powerful leader crosses the “will be allowed to retire peacefully” line, as Putin certainly has, he has to become obsessed with power all the more, even if the demand for traditional goods and services does not fade away. Without ongoing power, the life of that leader simply will end and all consumption will fall to zero, therefore cementing in a kind of power addiction all the more.
Model these Sweden Denmark lower inflation rates
Sweden’s annual inflation rate rose to 2.5 percent in September of 2021 from 2.1 percent in August but below market expectations of 2.7 percent. It was the highest since November of 2011, mainly due to prices of housing & utilities (5.1 percent vs 3.8 percent in August), namely electricity and transport (6.2 percent vs 6.4 percent), of which fuels. Additional upward pressure came from education (2.5 percent vs 2 percent); restaurants & hotels (2.4 percent vs 2.6 percent); miscellaneous goods & services (2 percent vs 1.4 percent) and food & non-alcoholic beverages (0.9 percent vs 0.3 percent). Consumer prices, measured with a fixed interest rate, rose 2.8 percent year-on-year in September, the fastest pace since October of 2008, below market expectations of 3 percent but above the central bank’s target of 2 percent. On a monthly basis, both the CPI and the CPIF rose 0.5 percent.
Here is the link, they are an open economy facing lots of supply shocks, right? So what is up?
Denmark’s annual inflation increased to 2.2% in September of 2021 from 1.8% in the previous month. It was the highest inflation rate since November 2012, due to a rise in both prices of electricity (15.2%), pointing to the highest annual increase since December 2008 and gas (52.8%), which is the highest annual increase since July 1980.
I thank Vero for the pointer. In an email to me she asks:
“If supply issues are the only cause of our inflation woes, then why is it that countries that spent less than 5% of GDP on the pandemic are experiencing average inflation of 2.15%? While countries that spent over 15% of GDP are experiencing average inflation of 3.94%? I don’t know the answer but I think it is worth asking this question.”
Anyone?
The Hanson Grabby Aliens Model
Robin is more inclined to draw big conclusions from absences than I am but this is a cool video on the Grabby Aliens Model. And here is the Robin Hanson, Daniel Martin, Calvin McCarter, Jonathan Paulson paper forthcoming in Astrophysical Journal.
My emails to Arnold Kling about the correct inflation model
After I cited low ten-year securities yields, Arnold asked for my basic model of inflation, here was my first email:
- Price level dynamics and money supply processes are murky, at least in recent times
- The median voter hates inflation
- The Fed won’t let inflation happen
…is my model.
I would add a dose of “inflationary pressures really do seem to be distributed pretty unevenly.”
End of email! Here was my second email to Arnold:
I think the Fed knows the true model in gross terms.
I also think there is a good chance the Fed will create a recession in limiting inflation.
But look at Japan. The EU. Even Italy. It’s not just the US.
Temporary inflation pressures all over the place, due to Covid and post-Covid adjustments. No fiscal financial crises. No long-term inflationary expectations of much note. Not in the developed nations.
The stock of saved wealth is now quite high relative to debt and deficits, especially if you count human capital.
So both the basic model and the markets predict no catastrophe, and also no run-away inflation. And central banks know how to boost the demand for money when needed.
Seigniorage returns from inflation are especially low in the contemporary environment, checking another motive for inflation. No “Assignats” revenue is in the works here.
I just don’t see what we’ve got “in the toolbox” to override all of that.
End of email! I should note that I agree with Summers that inflation is higher than it needs to be, that is bad, and it is because we overshot on our combined monetary/fiscal response.
I’ll also repeat my standard challenge: are you short the long bond? Are you buying those puts? I’m not so convinced if all you’ve got is “I’m not buying so many equities any more!”
They modeled this — why women might see fewer STEM ads
Women see fewer advertisements about entering into science and technology professions than men do. But it’s not because companies are preferentially targeting men—rather it appears to result from the economics of ad sales.
Surprisingly, when an advertiser pays for digital ads, including postings for jobs in science, technology, engineering and mathematics (STEM), it is more expensive to get female views than male ones. As a result, ad algorithms designed to get the most bang for one’s buck consequently go for the cheaper eyeballs—men’s. New work illustrating this gap is prompting questions about how that disparity may contribute to the gender gap in science jobs.
…As a result of that optimization, however, men saw the ad 20 percent more often than women did…
Tucker ran $181 worth of advertising via Google, for example, saying she was willing to pay as much as 50 cents per click. It ended up costing 19 cents to show the ad to a man versus 20 cents to show that same ad to a woman. These investments resulted in 38,000 “impressions”—industry-speak for ad views—among men, but only about 29,000 impressions among women.
Similarly, on Twitter it cost $31 to get about 52,000 impressions for men but roughly $46 to get 66,000 impressions for women. And on Instagram it cost $1.74 to get a woman’s eyeballs on the ad but only 95 cents to get a man’s.
Here is the full Scientific American article, via Luke Froeb, and do note those differentials may vary considerably over time. Gender issues aside, I would say this reflects a broader problem with having a very high value of time — it becomes harder to maintain a relatively high proportion of people showing you valuable things you wish to see (as opposed to people bugging you, grifting you, etc.).
Basil Halperin on sticky wage vs. sticky price models
Here is a long post, full of insight and citations, basically arguing that sticky wage models are better for macro than sticky price models. Sticky wage models had been deemphasized because real wages seemed to be acyclical, but sticky prices can’t quite do the work either. The post is hard to summarize, but my reading of it is a little different than what the author intends. My takeaway is “Sticky wages for new hires are the key, and we didn’t have real evidence/modeling for that until 2020, so isn’t this all still up in the air?” I am a big fan of the Hazell and Taska piece, which I consider to be one of the best economics contributions of the last decade, but still…I don’t exactly view it as confirmed and all nailed down. I do believe in nominal stickiness of (many not all) wages, but I still don’t think we have a coherent model matching up the theory and the empirics for how nominal stickiness drives business cycles. I thus despair when I see so many dogmatic pronouncements about labor markets.
For the pointer I thank João Eira.
A simple model of grabby aliens
According to a hard-steps model of advanced life timing, humans seem puzzlingly early. We offer an explanation: an early deadline is set by ‘grabby’ civilizations (GC), who expand rapidly, never die alone, change the appearance of the volumes they control, and who are not born within other GC volumes. If we might soon become grabby, then today is near a sample origin date of such a GC. A selection effect explains why we don’t see them even though they probably control over a third of the universe now. Each parameter in our three parameter model can be estimated to within roughly a factor of four, allowing principled predictions of GC origins, spacing, appearance, and durations till we see or meet them.
That is a new paper from Robin Hanson, Daniel Martin, Calvin McCarter, and Jonathan Paulson. And here is Robin’s associated blog post.
The end of the Swedish model
The government this week proposed an emergency law that would allow it to lock down large parts of society; the first recommended use of face masks came into force; and the authorities gave schools the option to close for pupils older than 13 — all changes to its strategy to combat the pandemic.
“I don’t think Sweden stands out [from the rest of the world] very much right now,” said Jonas Ludvigsson, professor of clinical epidemiology at Karolinska Institutet in Stockholm. “Most of the things that made Sweden different have changed — either in Sweden or elsewhere.”
…Sweden has reported more than 2,000 Covid-19 deaths in a month and 535 in the past eight days alone. This compares with 465 for the pandemic as a whole in neighbouring Norway, which has half the population. As Sweden’s King Carl XVI Gustaf said just before Christmas: “We have failed.”
Here is more from the FT. U.S. Covid deaths per day have now exceeded 4,000 for some days, and they are running at about 50% of the normal number for total daily deaths. And no, it is not that the payments to classify these as Covid deaths have increased, rather the virus and the deaths have increased. So the “no big deal” question we now can consider settled? The new and more contagious strains haven’t even started playing a major role yet in the United States.
Dark matter, second waves and epidemiological modelling
Here is a new paper from , , and :
Background Recent reports based on conventional SEIR models suggest that the next wave of the COVID-19 pandemic in the UK could overwhelm health services, with fatalities that far exceed the first wave. These models suggest non-pharmaceutical interventions would have limited impact without intermittent national lockdowns and consequent economic and health impacts. We used Bayesian model comparison to revisit these conclusions, when allowing for heterogeneity of exposure, susceptibility, and viral transmission. Methods We used dynamic causal modelling to estimate the parameters of epidemiological models and, crucially, the evidence for alternative models of the same data. We compared SEIR models of immune status that were equipped with latent factors generating data; namely, location, symptom, and testing status. We analysed daily cases and deaths from the US, UK, Brazil, Italy, France, Spain, Mexico, Belgium, Germany, and Canada over the period 25-Jan-20 to 15-Jun-20. These data were used to estimate the composition of each country’s population in terms of the proportions of people (i) not exposed to the virus, (ii) not susceptible to infection when exposed, and (iii) not infectious when susceptible to infection. Findings Bayesian model comparison found overwhelming evidence for heterogeneity of exposure, susceptibility, and transmission. Furthermore, both lockdown and the build-up of population immunity contributed to viral transmission in all but one country. Small variations in heterogeneity were sufficient to explain the large differences in mortality rates across countries. The best model of UK data predicts a second surge of fatalities will be much less than the first peak (31 vs. 998 deaths per day. 95% CI: 24-37)–substantially less than conventional model predictions. The size of the second wave depends sensitively upon the loss of immunity and the efficacy of find-test-trace-isolate-support (FTTIS) programmes. Interpretation A dynamic causal model that incorporates heterogeneity of exposure, susceptibility and transmission suggests that the next wave of the SARS-CoV-2 pandemic will be much smaller than conventional models predict, with less economic and health disruption. This heterogeneity means that seroprevalence underestimates effective herd immunity and, crucially, the potential of public health programmes.
This would appear to be one of the very best treatments so far, though I would stress I have not seen anyone with a good understanding of the potential rotation (or not) of super-spreaders, especially as winter comes and also as offices reopen. In that regard, at the very least, modeling a second wave is difficult.
Via Yaakov Saxon, who once came up with a scheme so clever I personally sent him money for nothing.
The Supply and Demand Model Predicts Behavior in Thousands of Experiments
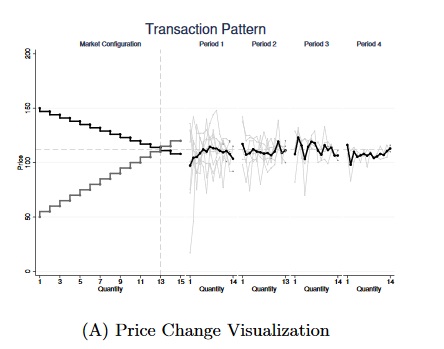 It is sometimes said that economics does not predict. In fact, Lin et al. (2020) (SSRN) (including Colin Camerer) find that the classic supply and demand model predicts behavior and outcomes in the double oral auction experiment in thousands of different experiments across the world. The model predicts average prices, final prices, who buys, who sells, and the distribution of gains very well as Vernon Smith first showed in the 1960s.
Indeed, the results from simple competitive buyer-seller trading appear to be as close to a culturally universal, highly reproducible outcome as one is likely to get in social science about collective behavior. This bold claim is limited, of course, by the fact that all these data are high school and college students in classes in “WEIRD” societies (Henrich et al.,2010b). Given this apparent robustness, it would next be useful to establish if emergence of CE in small buyer-seller markets extends to small-scale societies, across the human life cycle, to adult psychopathology and cognitive deficit, and even to other species.
It is true that economic theory is less capable of explaining the process by which prices and quantities reach equilibrium levels. Adam Smith’s theory about how competitive equilibrium is reached (“as if by an invisible hand”) has been improved upon only modestly. The authors, however, are able to test several theories of market processes and find that zero-intelligence theories tend to do better, though not uniformly so, than theories requiring more strategic and forward thinking behavior by market participants. The double-oral auction is powerful because the market is intelligent even when the traders are not.
The authors also find that bargaining behavior in the ultimatum game is reproducible in thousands of experiments. Simple economic theory makes very poor predictions (offer and accept epsilon) in this model but the deviations are well known and reproducible around the world (participants, for example, are more likely to accept and to accept quickly a 50% split than a split at any other level).
The experiments were run using MobLab, the classroom app, and were run without monetary incentives.
Tyler and I use Vernon Smith’s experiments to explain the Supply-Demand model in our textbook, Modern Principles, and it’s always fun to run the same experiment in the classroom. I’ve done this many times and never failed to reach equilibrium!
Economists modify a SIR model with a spatial and also behavioral dimension
We simulate a spatial behavioral model of the diffusion of an infection to understand the role of geographical characteristics: the number and distribution of outbreaks, population size, density, and agents’ movements. We show that several invariance properties of the SIR model with respect to these variables do not hold when agents are placed in a (two dimensional) geographical space. Indeed, local herd immunity plays a fundamental role in changing the dynamics of the infection. We also show that geographical factors affect how behavioral responses affect the epidemics. We derive relevant implications for the estimation of epidemiological models with panel data from several geographical units.
That is from a new paper by Alberto Bisin and Andrea Moro. Here is a good sentence from the accompanying and descriptive tweet storm:
In Spatial-SIR, local herd immunity slows contagion initially in the less dense city, but faster global herd immunity slows it in the denser city later
I think this means West Virginia is in for some hard times fairly soon.
Implications of Heterogeneous SIR Models for Analyses of COVID-19
This paper provides a quick survey of results on the classic SIR model and variants allowing for heterogeneity in contact rates. It notes that calibrating the classic model to data generated by a heterogeneous model can lead to forecasts that are biased in several ways and to understatement of the forecast uncertainty. Among the biases are that we may underestimate how quickly herd immunity might be reached, underestimate differences across regions, and have biased estimates of the impact of endogenous and policy-driven social distancing.
That is the abstract of a new paper by Glenn Ellison, recommended.
Toward a model of the New York City police
Bill de Blasio has excused police officers who swing batons at unarmed protesters and ram their vehicles into crowds. He has repeatedly stuck by his commissioner, Dermot Shea, and maintained the police have acted with the utmost discretion, though eyewitness testimony and videos suggest otherwise. Former aides who worked to elect a mayor on a platform of police reform are aghast. What went wrong, exactly?
Why does the Mayor of New York City defer so egregiously to his police department? Why does this keep happening?
Mass protests aren’t new to New York City. Neither is police violence. The police department in New York is a paramilitary that operates with little accountability, relative to other city agencies. A police commissioner in New York can be thought of as an appointed mayor of a quasi-independent fiefdom. The police commissioner, ultimately, must answer to the mayor and City Council—mayors can fire commissioners at any time—but the police can cow those who oppose them politically. As recently as 2015, one year after Eric Garner died in police custody, the otherwise progressive City Council led a multi-year campaign to hire 1,000 new police officers. This year, in their latest stimulus bill, House Democrats included $300 million for a nationwide police expansion. Politicians of both political parties have supported bolstering police power for decades.
That is from Ross Barkan, here is more:
Police, in this calculus, safeguard property value. If police don’t do their jobs, a mainstream Democratic politician would tell you, the city could spiral into chaos. Crime would skyrocket. Property value would decline. The real estate and investor class would lose confidence in New York and stop investing their capital. Any pivot toward a model of social democratic urban planning—or even, at the minimum, a reduction in the NYPD’s near $6 billion budget—would trigger this unraveling. De Blasio’s appointment of Bratton, the Giuliani-era police commissioner, can be understood in this context. Bratton was a liberal mayor’s concession to a business and real estate establishment he believed needed to be placated. It was a signal that his administration, no matter its reputation, would never veer too far left. De Blasio is of the belief that any progressive reform can’t happen without police to maintain New York’s low crime rate. Any spike will sap political capital for his projects.
Police unions understand politicians. Pat Lynch has been leading the PBA since 1999. He has merely followed a playbook written by past union presidents, who literally staged riots and race-baiting, citywide referendums when mild reforms of the department were proposed. The threat police have dangled over mayors, left and right, is rather simple: you make us angry and we will unleash disorder.
There is more of interest at the link, and for the pointer I thank Jordan.
The Japan model
So what is the Japan model? First, it is a cluster-based approach, derived from a hypothesis obtained from an epidemiological study based on Chinese data and conducted on the Diamond Princess cruise ship that entered the port of Yokohama on February 3, 2020. This hypothesis accounts for the many passengers who were not infected with the coronavirus despite having had close contact with infected persons. It posits that the explosive increase in infected persons is a result of the high transmissibility of certain infected individuals, which forms a cluster. Infected individuals with even higher transmissibility appear from these clusters to form more clusters and infect many others. Based on this hypothesis, under the cluster-based approach, each cluster is tracked to the original infection source and persons with high transmissibility are isolated to prevent the spread of infection. For this reason, pinpoint testing is carried out and broad testing of the population is not required, in contrast to the approaches taken in other counties.
This cluster-based approach is conditioned on an environment in which there are only a few infected persons and clusters are detectable at an early stage. In February 2020, when the spread of infection was observed in Hokkaido, a cluster-based approach was adopted. As a result, Hokkaido was successfully able to contain its outbreak.
For the cluster-based approach to be effective, protective measures at airports and ports are important. Hokkaido has the advantage of being an island, making it comparatively easy to control the inflow of infected people. Behavioral changes are also required. On February 28, 2020, acting without legal basis, Hokkaido Governor Naomichi Suzuki declared a state of emergency and called on residents to refrain from going outside. Residents took the call seriously, and are responsible for the success of the cluster-based approach. Following its success in Hokkaido, the cluster-based approach was adopted nationally. On February 25, 2020, a Cluster Response Team was established in the Ministry of Health, Labour and Welfare.
Here is more from Kazuto Suzuki, with other points of note.