Measuring risk with VIX and VXV
Discussing Robert Hall’s latest (pdf), Paul Krugman asks for a measure which shows the evolution of the risk premium for the U.S. economy. Here is one possible candidate:
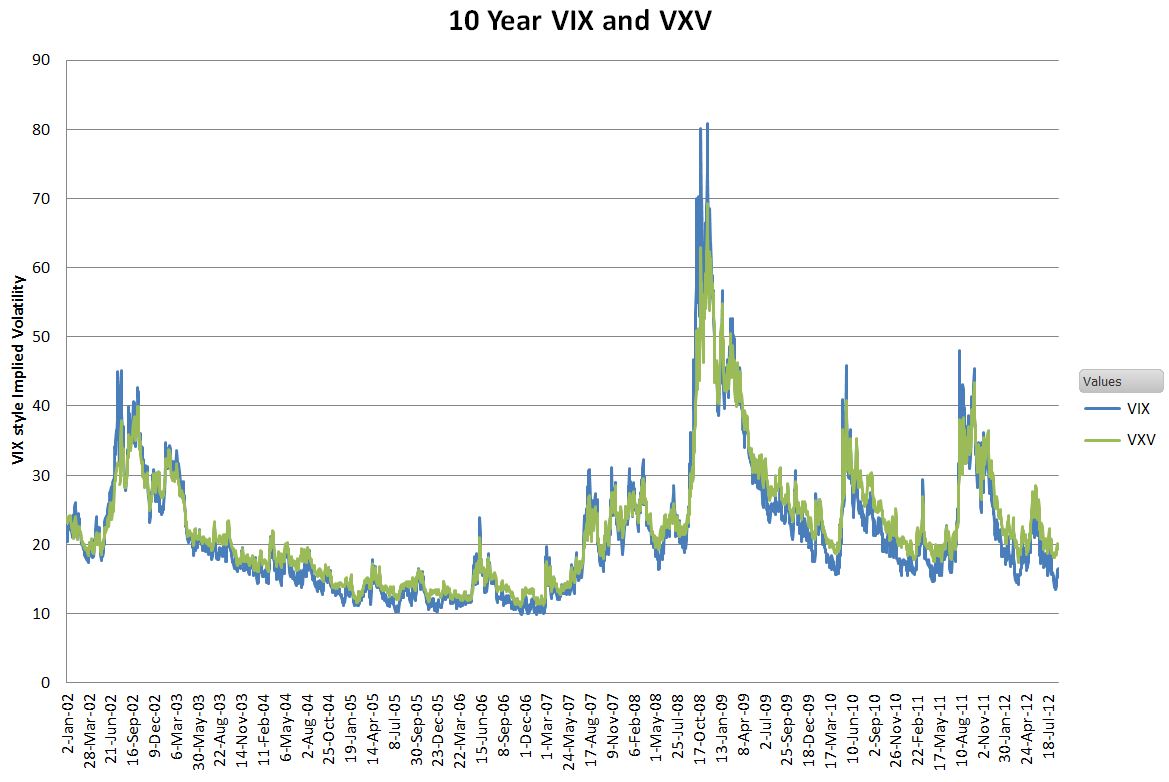
Here is one discussion of that graph, and the difference between VIX and VSV. Here is a systematic look at VIX. It is “…a key measure of market expectations of near-term volatility conveyed by S&P 500 stock index option prices. Since its introduction in 1993, VIX has been considered by many to be the world’s premier barometer of investor sentiment and market volatility.”
You can see that as of late 2011 measured risk is still fairly high. A wag might also wonder about the risk of measured risk and that seems to show a few noticeable bounce backs since the worst of the crisis period, suggesting that the U.S. economy has not really been in the clear.
Another relevant measure of risk is that people were for years willing to lend the Treasury money at negative two percent real rates of return, and at a time when equity returns turned out to be strongly positive and growth was moderately positive. That is to me the single strongest piece of information about risk. Someday (already?) we’ll look back and marvel at those prices.
This report from the Cleveland Fed shows how much small business lending has dried up, and much of this turns up in quantities rather than prices.
So in my view the evidence for higher risk premia is quite strong.