Category: Economics
Brazil’s economic problems, in a nutshell
It would take true Milei-like ardour to slice through Brazil’s economic troubles. These are caused by a gnarly mix of high public spending, stubborn inflation and low saving. The result is a crippling cost of capital. Some analysts put Brazil’s real interest rate, the BCB’s policy rate adjusted for next year’s expected inflation, at 9% or more. That is higher than in Russia and four times that in peaceful peers like Chile, the Philippines or South Africa.
It all starts with the public finances. Brazil’s 65,000-word doorstop of a constitution bars cuts to nominal public-sector wages and links pension, disability and unemployment benefits to the minimum wage, which is adjusted annually based on recent inflation and GDP growth. This ratchet has lifted mandatory spending to 90% of the federal budget.
It also perpetuates inflationary pressure. This plus a generous welfare state in turn make Brazilians unwilling to save. At 14% of GDP, the national savings rate is 12 percentage points below the world average. If price rises have regularly eroded your bank balance in the past and the state pays for your health care, school and pension, you may as well spend all the money you make right away—especially if, like most people in unequal Brazil, you do not make much to begin with.
Here is more from The Economist.
Facts about breastfeeding
We produce a numerical estimate of the value of unpaid breastfeeding relative to national income spanning five centuries and integrating historical and bioarchaeological data. The relative economic contribution of maternal nursing was greater in the distant past than in recent history, rivaling regionally significant industries such as pottery, glassmaking, and even the historical public sector. It was likely the largest source of human capital investment in early modern England, supporting the physical and cognitive development of the workforce. Finally, we show that breastfeeding rates probably fell as incomes rose, challenging the Malthusian assumption that higher income correlates with lower mortality.
That is from a recent paper by Louis Henderson and Jane Humphries. Via the excellent Samir Varma.
How central bankers spend their time
How leaders allocate their limited time and attention is an important question in economics. This paper constructs and analyzes a novel data set covering the daily calendars of three Federal Reserve Chairs, Ben Bernanke, Janet Yellen, and Jerome Powell, containing more than 20,000 calendar entries. We document several patterns. First, all Fed Chairs spend more than 30% of their documented meetings with Fed staff, highlighting the crucial role of economists in the Fed’s decision process. Second, interactions with the media became more frequent during Bernanke’s tenure and remained important until the end of Powell’s tenure. Third, Powell held significantly more meetings with lawmakers than both Yellen and Bernanke, reflecting an increasing need for the Fed to engage with political actors. Beyond these trend patterns, we examine the time allocation of Fed Chairs at business cycle frequencies and show how different activities respond to shifts in the macroeconomic environment. Finally, we place our findings in historical context using the available calendars of earlier Fed Chairs, including Alan Greenspan.
That is from a recent NBER working paper by
Econvitals
From Jason Furman, it tracks economic indicators, mostly U.S. Here is the website. Subscribe here to briefings. Here is a thread on the site.
Prediction Markets Are Accurate
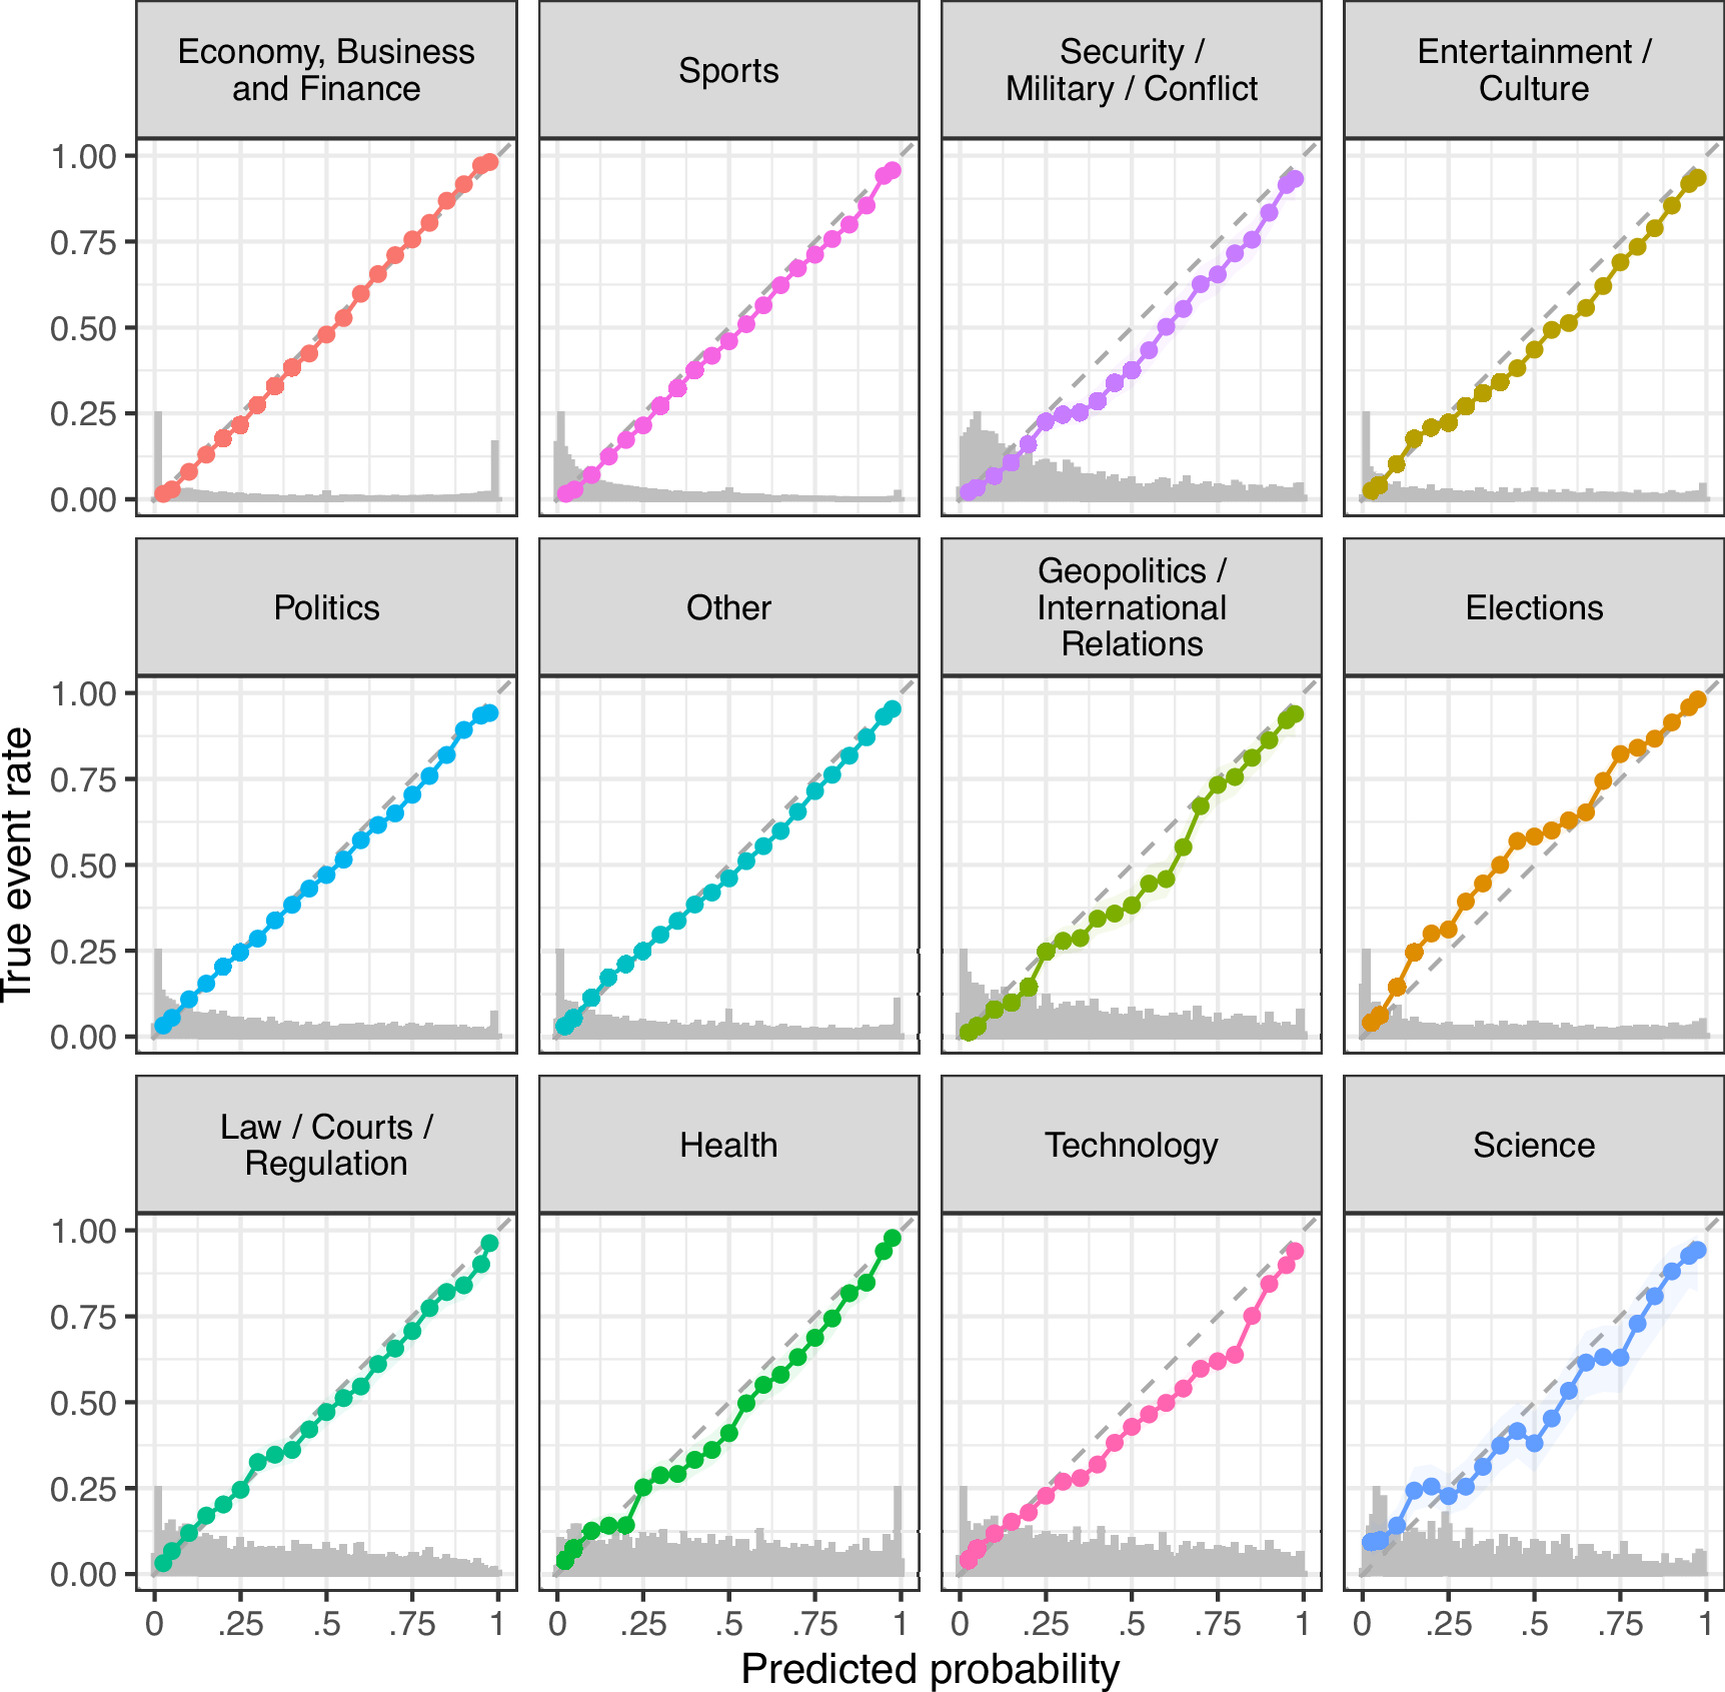
No surprise to me but a new paper looks at the forecast accuracy of over one million prediction questions from Polymarket, Kalshi, Manifold and the forecasting platform Metaculus. A virtue of the new analysis is that it covers many different areas from business to elections to geo-politics. An event predicted to happen p% of the time happens about p% of the time. Can’t beat that.
Using approximately one million resolved contracts and questions across four collective forecasting platforms, twelve domains, and time horizons ranging from hours to years, we evaluate the calibration and accuracy of collective forecasts in real-world settings. We found that forecast probabilities were overall highly calibrated: events assigned a probability of p% occurred approximately p% of the time. This broad pattern was evident across platforms and many domains, although fine-grained analyses revealed systematic tendencies toward over- or underestimation in highly consequential areas. While this does not mean that forecasting platforms provide certainty about individual events, our findings suggest that large-scale aggregation of judgments contains meaningful information about real-world uncertainty; when examined in aggregate, the predictions generated by the platforms provided informative estimates of event likelihood.
Protecting Americans from Medicine
Max Doppelt: In January 2025 my mom’s lung cancer spread to her brain. The drug with the best chance of helping her was approved in China but not here.
A doctor told me, almost as an aside, that if she were Chinese she could buy it at a pharmacy.
So I flew to Shanghai and came home with 26 boxes in my luggage. That was 19 months ago. My mom is still here, still working, and in her words has had an amazing three years.
The drug was approved in China in 2023. The FDA approved it in July 2025. It still is not for sale here. I know of at least 30 Americans who have made the same trip.
I have been scared to tell this story because I worried it could cost my mom access to the medicine keeping her alive. But the problem matters more than my silence. These drugs need to be developed and available here, and that means FDA reform.
A piece at KFF Health cover’s Max’s story and adds this insanity:
Rep. John Moolenaar (R-Mich.), who chairs the House Select Committee on the Chinese Communist Party, in June co-sponsored legislation with Rep. Debbie Dingell (D-Mich.) requiring all U.S. pharmaceutical deals with Chinese companies to be cleared by the Treasury Department.
Got that? A son flew to Shanghai to buy pharmaceuticals to extend his mother’s life and the House Select Committee on the Chinese Communist Party wants a Treasury lawyer monitoring the baggage claim. Yes, I am angry.
Addendum: See also my earlier post on Operation TrialBlazer and Montana’s SB535. My 2009 TED Talk is the ur-source for my argument that a rich China and India will create many benefits for the United States, including many more cancer drugs.
Will bystander economies be able to finance their governments?
From Jesús Fernández-Villaverde:
Will AI poison the public finances of many modern states? There is a real risk that it will.
Yesterday, I circulated a new paper, “Saving for the Machines,” which makes a simple point. Building the AI transformation will require enormous investment. The only way to induce agents to save for that investment is through a large increase in the real interest rate. For instance, in my benchmark scenario, the ten-year real yield jumps from 5.1% to 13.6% on impact.
But that means government borrowing will become much more expensive. Here is a back-of-the-envelope calculation. Take a government that owes 100% of GDP in 2025 (a typical case in Western Europe) and runs a balanced primary budget from then on (not so typical but never mind; I want to build an optimistic scenario). That means the debt ratio changes only with the gap between the real interest rate and growth.
I input the interest rate and the growth rate for my benchmark transition to full automation, and I roll over the debt at the short rate. I consider two economies. The first economy is an AI adopter, for example, the U.S., which experiences an AI boom at home. The government pays the new interest rate but also enjoys faster growth.
The second economy is a bystander, for example, Spain. This economy lives in an integrated financial market but does not adopt AI (this is an extreme case of zero adoption, just to make the exercise transparent): it pays the same world interest rate and continues growing at its old 1.6% trend.
Let’s first consider the adopter. With an intertemporal elasticity of substitution of one-half, the Euler equation implies that consumption growth is about half the real interest rate. Hence, the gap between the interest rate and growth does not close during the AI-driven growth boom. Instead, it widens. For example, with a unit elasticity of substitution among tasks, the real rate rises from 5.1% to 42% by 2040, while growth increases only from 1.6% to 22%. Debt doubles by 2038, reaches 296% of GDP in 2040, and 907% in 2045. To hold the ratio at 100%, the government needs a primary surplus of 10% of GDP in 2035 and 24% from 2045 onward. With a low elasticity of substitution of 0.2, the numbers are milder, but the pattern is the same: 204% in 2040, 397% in 2045, and a stabilizing surplus of 13% of GDP.
But the adopter has a way out. The capital share goes to one, so net capital income is about 88% of GDP, and a flat tax on it can cover the surplus. A 36% tax on net capital income holds the debt at 100% of GDP in the limit with unit elasticity, and a 20% tax does so with strong complementarity across tasks. The tax is above the gap because it slows growth, from 21.9% to 13.6% with unit elasticity and from 11.7% to 9.1% with an elasticity of 0.2, while it does nothing to the rate the Treasury pays, which technology pins at the machines’ net return. Painful, but the boom survives and the adopter can pay its debt.
The grim news is that the bystander economy has no way out. Its capital income is still a third of GDP, which grows at 1.6%, and the surplus it needs is 11% of GDP in 2030, 26% in 2035, and 44% forever with unit elasticity (18% and 24% with an elasticity of 0.2). On a balanced primary budget, its debt doubles by 2033 and triples by 2035. No tax system raises that.
Two more bad pieces of news for the bystander. First, long yields jump on impact, so a Treasury that issues ten-year debt pays more, and sooner, than rolling over at the short rate assumes: it is the same bill but front-loaded. Second, the bystander’s own capital flows to the machines abroad, so its GDP and tax base fall below trend. One relief is that households can save for other people’s machines and get rich on the returns, which the bystander’s government can tax to some extent. This back-of-the-envelope calculation is a benchmark, not a forecast of what is to come. But the arithmetic is simple, and it runs counter to the hope that an AI-fueled growth boom will take care of public debt, because growth comes with an interest rate that is twice as high. Not a pretty future for most of Western Europe. Due to AI, the choice is between default, inflation, or, most likely, financial repression: capital controls that keep domestic savers from investing in machines abroad.
I am somewhat more optimistic than this. The assumption of zero Spanish adoption already is noted, but also ideas are public goods, and Spain can benefit from American (and Chinese) AI, and the resulting scientific advances. The long-run supply of capital also might be quite elastic, we will see.
How Long Do Wealth Shocks Persist? Less Than Three Generations in England, 1700–2026
What happens across generations to wealth shocks? Do they endure and even magnify, or do they dissipate? By implication, how much modern wealth is attributable to events before 1900? This paper uses random shocks to family size in England before 1880 that created wealth shocks for the children to measure the persistence of wealth shocks. Fertility in England before 1880 was a biological lottery. For richer families, family size strongly influenced child wealth. This paper finds that such biology-induced wealth shocks had no impact on descendant wealth by three generations later. Since wealth itself persisted across more than five generations this implies that, in the long run, wealth mainly derives from sources other than inherited wealth. The observed link between nineteenth century and modern wealth does not lie in wealth transfers alone. Wealth persisted because of the familial inheritance of behaviors associated with wealth accumulation and retention.
That is from a recent paper by Gregory Clark and Neil Cummins. Via the excellent Kevin Lewis.
Modern Principles of Economics!
If you are teaching economics Modern Principles is the book to use! Great and original writing, over one hundred videos, iClicker, Achieve and lots of additional support. Contact Mike Krotine to get an examination copy.
The Causal Effect of Foreign Ideas on U.S. Innovation
Globalization is once again better than many people realize:
We study the role of foreign ideas in U.S. innovation by constructing a directed “genealogy” of technologies from the full text of 13 million patents filed between 1887 and 2024. By tracing which earlier technologies appear in the founding patents of new ones, we recover a large-scale input–output network of technological recombination that identifies the foreign technologies that serve as inputs into innovation in the United States. We report four main findings. First, foreign ideas are pervasive: 54% of U.S. technologies build on at least one foreign input, and the most fertile U.S. technologies rely on foreign inputs most heavily. Second, foreign ideas have large causal effects on U.S. innovation. Using the historical settlement of migrants as a source of exogenous variation in local ancestry, we show that U.S. counties more exposed to knowledge from a given foreign country absorb substantially more technologies from that country and, in turn, invent significantly more U.S. technologies building on them. Third, foreign ideas shape not only the level but also the direction of technical change: U.S. counties are far more likely to pioneer the specific technologies whose foreign inputs are already in their local idea stock, and the changing origins of foreign ideas accompany the shift of American innovation from its historical heartland toward the coasts. Fourth, these effects leave a lasting imprint on local labor markets: decades later, counties that absorbed more of an origin’s ideas host more jobs working with those ideas, and even more work with the U.S. technologies descended from them.
Here is the full paper by
Saving for the machines
From Jesús Fernández-Villaverde:
When machines can perform a growing share of tasks, growth depends on two margins: how the task structure affects the returns to accumulating machines, and how strongly capital accumulation responds to those returns. I argue that, in a standard task model, capital supply governs the size of the growth boom associated with automation, while the task structure sets the duration of this growth boom and the evolution of wages. I document how the same technology path that generates 11.7% annual growth when households choose their saving rate optimally delivers only 2.2% when the saving rate is fixed at the calibrated U.S. 2025 level of 23%. Therefore, slow growth might reflect too little capital accumulation instead of a technological bottleneck. Also, the saving rate rises mainly because automation raises the capital share, not because households become thriftier. Long yields price the growth boom: the ten-year real yield jumps from 5.1% to 13.6% on impact. In my benchmark calibration, hand-to-mouth households lose the equivalent of two-fifths to two-thirds of their consumption, while keeping them on trend temporarily costs at most a fifth of GDP.
Here is a thread on the paper. Here are the slides. More bottlenecks!
The net fiscal impact of immigration should include gains from trade
Immigration affects natives through both labor markets and public budgets, yet these channels are usually studied separately. We combine them in a general-equilibrium model with search-and-matching frictions, skill-specific progressive labor taxes, capital taxation and public goods, calibrated to 17 OECD countries over 2015-2019. The welfare effect on natives of a one-percentage-point increase in immigrant inflows varies in sign and size across countries, hinging on immigrants’ skill mix, immigrant-native wage gaps, resident unemployment, and tax progressivity. For inflows matching the skill composition of 2019-2024 arrivals, native welfare rises in 14 of 17 economies, and in most cases both skill groups gain, through different channels. Lower-skilled natives gain mainly from higher pre-tax earnings, driven by job creation and complementarity with skilled immigrants; higher-skilled natives gain mainly from lower labor-tax burdens. Evaluating immigration policy thus requires modeling labor-market and fiscal channels jointly: either channel alone gives an incomplete picture of who gains and why.
That is from a new NBER working paper by
As a side note, I do not accept the authors’ claim that the immigrants are equally productive yet underpaid, and thus the native economy benefits from capturing that surplus. The better mechanism is simply that immigrants boost market size, and (especially for the United States) that brings some gains from increasing returns to scale, more innovation, making the country a talent magnet, and so on. The point holds that the gains from trade effect can be small, and it still will overwhelm what otherwise appear to be net fiscal costs.
The California billionaire tax is very likely a net revenue loser
This paper examines the revenue and migration impact of the 2026 California Billionaire Tax Act, a one-time 5 percent tax on the worldwide net worth of individuals exceeding $1 billion. Using data from the Forbes Billionaire List, news reports detailing the residential real estate holdings of California billionaires, and public announcements of billionaire departures from the state, we estimate the behavioral response and associated revenue loss to this new tax using several different methodologies. Even before accounting for reductions in other tax bases such as the income tax, we estimate that the Act will collect approximately $30 billion (range $28 to 36 billion), less than a third of the $100 billion projected by Galle et al. (2025). This range accounts for the publicly confirmed taxpayer migration that has already eliminated nearly 30 percent of the Act’s wealth tax base, applies a litigation-survival discount to the remaining base, and is validated by the wealth tax base elasticity literature. We estimate that California’s billionaires contribute $3.3–5.8 billion annually in state income taxes. The present value of permanently lost income tax collections from departures more than offsets the one-time wealth tax revenue, yielding a net present value of negative $38.9 billion. Across 100,000 simulated revenue and discount rate combinations, 85 percent of plausible outcomes produce a negative net present value of state revenues.
That is from a new NBER working paper by Benjamin Jaros and Joshua Rauh. Overall this issue is a good litmus test for who still thinks like an economist.
No, DataCenters are Not Crowding-Out Other Investments
 Based on charts like the one at right, Paul Krugman and many others are arguing that:
Massive spending on data centers is crowding out investment in everything else in the economy.
Not so fast. Can you see one immediate problem? How is $51b in data center construction spending crowding out $120b in everything else!
Indeed, crowding out in the standard loanable funds model is generically less than 1 to 1–that is, $51b of additional spending will crowd out less than $51b of other investment spending. The standard analysis is that increased investment demand/borrowing increases interest rates–the higher interest rate reduces investment demand elsewhere (that’s the crowding out) but the higher interest rate also increases savings so investment elsewhere falls by less than the increase in tech investment. Here’s the classic graph from our textbook, Modern Principles. In the graph, we explain crowding out in terms of government borrowing but formally the diagram is the same with tech borrowing substituting for government borrowing:
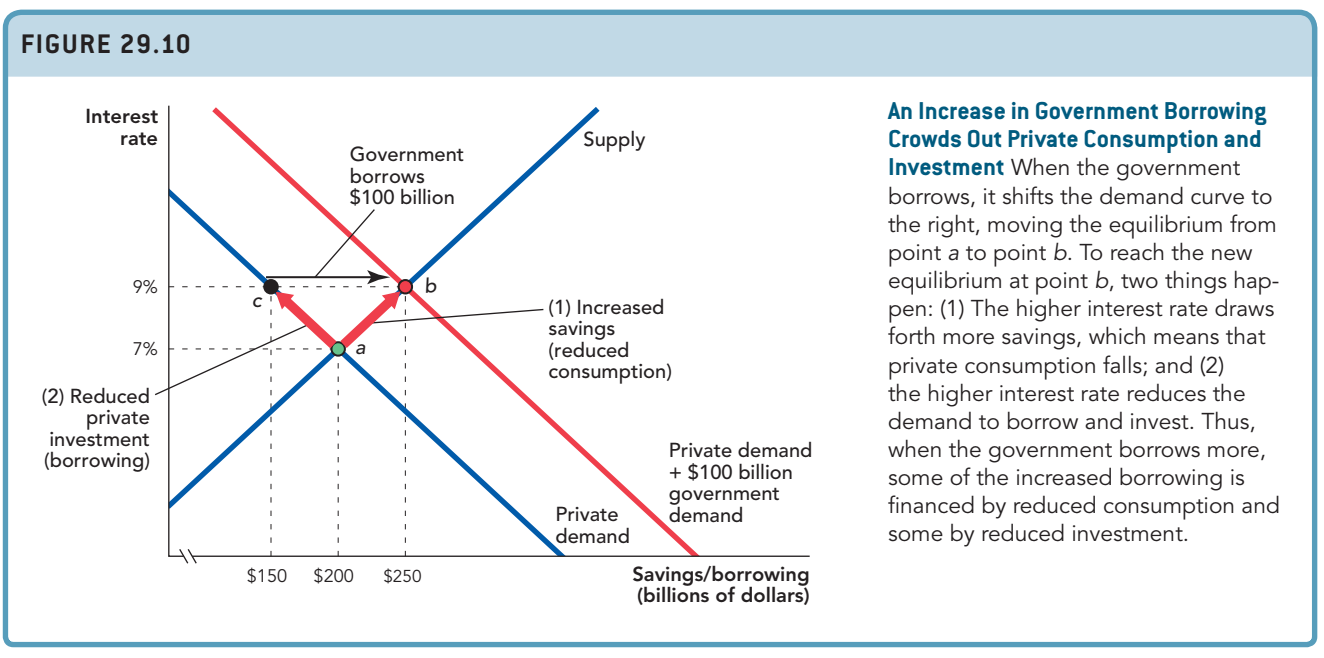
Although the diagram is formally identical with private borrowing or government borrowing the term crowding-out is usually reserved for the latter. Private borrowing faces the market test so “crowding out” in that context simply means funds flowing from lower value to higher valued uses–it’s a benefit. Government borrowing doesn’t face the same market test and so we need to remind people that it comes at a cost. Let’s put this point aside, however.
Krugman doesn’t point out the problem with Rattner’s graph but he does substitute with a graph of his own (shown below) which compares all “tech” investment with all other investment as a share of GDP. On the surface that seems to at least get the ratios in more plausible alignment but there are a few problems. First, the numbers are on a different order of magnitude. Rattner has annual datacenter investment rising to $51b (annual rate) over a more than two year period. Krugman has tech spending rising to ~$539b over a similar period–so far more than datacenters or AI as conventionally considered is being counted. That’s fine–but Krugman is relying here on datacenter discontent while actually discussing something different. But there is another problem.

Krugman’s graph is in terms of shares of GDP and as one share is going up, another is going down which is meant to be suggestive of crowding out–except GDP is increasing. Let’s regraph the same data in dollars and in real terms:

Now the picture looks different. From 2023 Q2 to 2026 Q2, real tech investment rose about 46%, while other real investment rose about 3%. Other investment has weakened since its 2024 peak, but it remains above its starting level. This does not rule out crowding out: other investment might have grown faster without the tech boom. But we have now gone from charts suggesting that crowding out was absolute to arguing that it was relative to GDP and relative to a counter-factual which cannot be identified with these graphs.
So what is really going on? Real interest rates are up since the pandemic but most of the increase happened before the AI investment boom. The average 10-year TIPS yield rose from −1.00% in late 2021 to 1.49% in late 2022. In comparison, the increase in rates over the Rattner/Krugman chart-periods are only .5 and 0.68 percentage points respectively, relatively small potatoes to hang a crowding out story.
Moreover, current real rates are ~2-3%, in line with historical averages and hardly prohibitive. If there are good projects they can be funded.
Why did real rates rise if not datacenter borrowing? There are many possible explanations: recovery from unusually low rates during the pandemic, Federal borrowing, maybe even a quite different tech story in which greater expectations of future wealth are reducing savings today (like the reputed AI workers who have taken up smoking because they expect a future cure for lung cancer). But note that real rates are up across advanced economies, not just here, even though most of the AI spending is here–this further weakens the case for crowding out of US investment, as the world saving base is much larger than the US base.
Bottom line is that I think a more plausible story is that two things are happening at once: tariffs, uncertainty, and other forces including the fading of Biden-era CHIPS and IRA subsidies have weakened investment outside AI-tech. The AI boom in contrast has supported overall investment. In other words, rather than datacenters and AI investment “crowding out” other investment, my interpretation is that AI investment is a bright spot in what would otherwise be a more negative economy.
Hat tip: Arpit Gupta.
Solving for the equilibrium?
Sixteen AI agents were each handed 1,000 satoshis of real bitcoin and told nothing about how to use it. A hundred rounds later, four of them had roughly doubled their money, two had been wiped out, and the three richest agents held more than half of all the bitcoin in the room. Nobody wrote a rule that said “exploit the trusting ones.” The agents found that on their own. This was not a thought experiment. It was a real study of AI agents and Bitcoin, run by an independent developer with 8 Claude agents and 8 GPT-4o agents, and its raw payment data is public. I downloaded every one of those payments and checked what they really show, including one headline claim that holds up better than I expected and one that does not hold up at all.
This matters now because the plumbing for AI agent payments arrived this year. In July 2026, Lightning Labs released Wavelength, a…
Here is more from Hayanan, via Sonia Farrell Pearson.