Renewables Are Disruptive to Coal and Gas
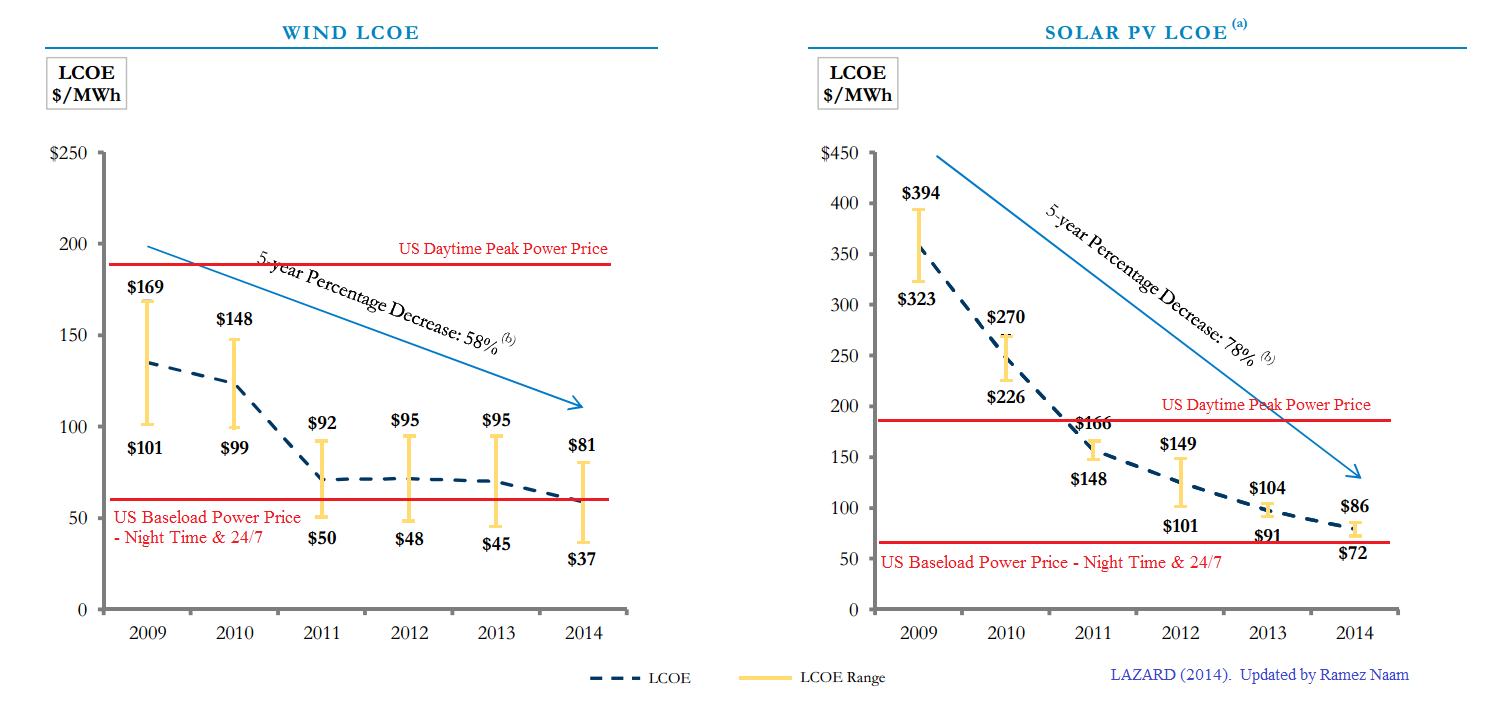
Over the last 5 years, the price of new wind power in the US has dropped 58% and the price of new solar power has dropped 78%. That’s the conclusion of investment firm Lazard Capital. The key graph is here (here’s a version with US grid prices marked). Lazard’s full report is here.
Utility-scale solar in the West and Southwest is now at times cheaper than new natural gas plants. Here’s UBS on the most recent record set by solar. (Full UBS solar market flash here.)
We see the latest proposed PPA price for Xcel’s SPS subsidiary by NextEra (NEE) as in NM as setting a new record low for utility-scale solar. [..] The 25-year contracts for the New Mexico projects have levelized costs of $41.55/MWh and $42.08/MWh.
That is 4.155 cents / kwh and 4.21 cents / kwh, respectively. Even after removing the federal solar Investment Tax Credit of 30%, the New Mexico solar deal is priced at 6 cents / kwh. By contrast, new natural gas electricity plants have costs between 6.4 to 9 cents per kwh, according to the EIA.
(Note that the same EIA report from April 2014 expects the lowest price solar power purchases in 2019 to be $91 / MWh, or 9.1 cents / kwh before subsidy. Solar prices are below that today.)
The New Mexico plant is the latest in a string of ever-cheaper solar deals. SEPA’s 2014 solar market snapshot lists other low-cost solar Power Purchase Agreements. (Full report here.)
- Austin Energy (Texas) signed a PPA for less than $50 per megawatt-hour (MWh) for 150 MW.
- TVA (Alabama) signed a PPA for $61 per MWh.
- Salt River Project (Arizona) signed a PPA for roughly $53 per MWh.
Wind prices are also at all-time lows. Here’s Lawrence Berkeley National Laboratory on the declining price of wind power (full report here):
After topping out at nearly $70/MWh in 2009, the average levelized long-term price from wind power sales agreements signed in 2013 fell to around $25/MWh.
After adding in the wind Production Tax Credit, that is still substantially below the price of new coal or natural gas.
Wind and solar compensate for each other’s variability, with solar providing power during the day, and wind primarily at dusk, dawn, and night.
Energy storage is also reaching disruptive prices at utility scale. The Tesla battery is cheap enough to replace natural gas ‘peaker’ plants. And much cheaper energy storage is on the way.
Renewable prices are not static, and generally head only in one direction: Down. Cost reductions are driven primarily by the learning curve. Solar and wind power prices improve reasonably predictably following a power law. Every doubling of cumulative solar production drives module prices down by 20%. Similar phenomena are observed in numerous manufactured goods and industrial activities, dating back to the Ford Model T. Subsidies are a clumsy policy (I’d prefer a tax on carbon) but they’ve scaled deployment, which in turn has dropped present and future costs.
By the way, the common refrain that solar prices are so low primarily because of Chinese dumping exaggerates the impact of Chinese manufacturing. Solar modules from the US, Japan, and SE Asia are all similar in price to those from China.
Fossil fuel technologies, by contrast to renewables, have a slower learning curve, and also compete with resource depletion curves as deposits are drawn down and new deposits must be found and accessed. From a 2007 paper by Farmer and Trancik, at the Santa Fe Institute, Dynamics of Technology Development in the Energy Sector :
Fossil fuel energy costs follow a complicated trajectory because they are influenced both by trends relating to resource scarcity and those relating to technology improvement. Technology improvement drives resource costs down, but the finite nature of deposits ultimately drives them up. […] Extrapolations suggest that if these trends continue as they have in the past, the costs of reaching parity between photovoltaics and current electricity prices are on the order of $200 billion
Renewable electricity prices are likely to continue to drop, particularly for solar, which has a faster learning curve and is earlier in its development than wind. The IEA expects utility scale solar prices to average 4 cents per kwh around the world by mid century, and that solar will be the number 1 source of electricity worldwide. (Full report here.)
Bear in mind that the IEA has also underestimated the growth of solar in every projection made over the last decade.
Germany’s Fraunhofer Institute expects solar in southern and central Europe (similar in sunlight to the bulk of the US) to drop below 4 cents per kwh in the next decade, and to reach 2 cents per kwh by mid century. (Their report is here. If you want to understand the trends in solar costs, read this link in particular.)
Analysts at wealth management firm Alliance Bernstein put this drop in prices into a long term context in their infamous “Welcome to the Terrordome” graph, which shows the cost of solar energy plunging from more than 10 times the cost of coal and natural gas to near parity. The full report outlines their reason for invoking terror. The key quote:
At the point where solar is displacing a material share of incremental oil and gas supply, global energy deflation will become inevitable: technology (with a falling cost structure) would be driving prices in the energy space.
They estimate that solar must grow by an order of magnitude, a point they see as a decade away. For oil, it may in fact be further away. Solar and wind are used to create electricity, and today, do not substantially compete with oil. For coal and natural gas, the point may be sooner.
Unless solar, wind, and energy storage innovations suddenly and unexpectedly falter, the technology-based falling cost structure of renewable electricity will eventually outprice fossil fuel electricity across most of the world. The question appears to be less “if” and more “when”.