On the Variability of Money and Real Output
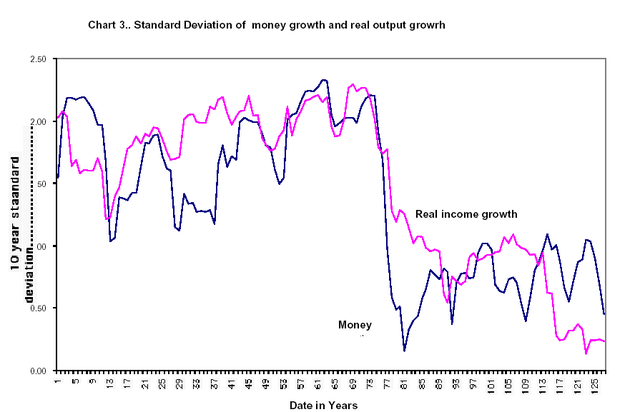
In one of Milton Friedman’s last papers (circa 2006) is this stunning graph. The graph (click to enlarge) shows the standard deviation of real output and money (M2) from 1879 to 2005. The sharp break in the series around the late 1970s and early 1980s is evident – the standard deviation of money fell dramatically and so did the standard deviation of output.
Money is partially endogenous so one could interpret this as running from output to money. The rapidity of the break, however, suggests otherwise. It’s easy to understand how policy could quickly have made money growth more stable. It’s much more difficult to understand how or why real output could quickly become more stable. Moreover, the fact that money stabilized as Volcker and then Greenspan headed the Fed is also suggestive of monetary policy as the driving force.
In one way this is a testament to better monetary policy beginning circa Volcker but in another it’s a damning indictment of how poor monetary policy has been over most of the history of the Federal Reserve.
