Debating Economics
Intelligence Squared has held a series of debates in which they poll ayes and nayes before and after. How should we expect opinion to change with such debates? Let’s assume that the debate teams are evenly matched on average (since any debate resolution can be written in either the affirmative or negative this seems a weak assumption). If so, then we ought to expect a random walk; that is, sometimes the aye team will be stronger and support for their position will grow (aye after – aye before will increase) and sometimes the nay team will be stronger and support for their position will grow. On average, however, we ought to expect that if it’s 30% aye and 70% nay going in then it ought to be 30% aye and 70% nay going out, again, on average. Another way of saying this is that new information, by definition, should not swing your view systematically one way or the other.
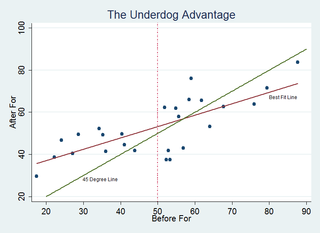
Alas, the data refute this position. The graph shown below (click to enlarge) looks at the percentage of ayes and nayes among the decided  before and after. The hypothesis says the data should lie around the 45 degree line. Yet, there is a clear tendency for the minority position to gain adherents – that is, there is an underdog advantage so positions with less than 50% of the ayes before tend to increase in adherents and positions with greater than 50% ayes tend to lose adherents. What could explain this?
I see two plausible possibilities.
1) If the side with the larger numbers has weaker adherents they could be more likely to change their mind.
2) The undecided are key and the undecided are lying.
For case 1, imagine that 10% of each group changes their minds; since 10% of a larger number is more switchers this could generate the data. The problem with 1 and with the data more generally is that we don’t seem to see a tendency towards 50:50 in the world. We focus on disputes, of course, but more often we reach some consensus (the moon is not made of blue cheese, voodoo doesn’t work and so forth).
Thus 2 is my best guess. Note first that the number of “undecided” swing massively in these debates and in every case the number of undecided goes down a lot, itself peculiar if people are rational Bayesians. A big swing in undecided votes is quite odd for two additional reasons. First, when Justice Roberts said he’d never really thought about the constitutionality of abortion people were incredulous. Similarly, could 30% of the audience (in a debate in which Tyler recently participated (pdf)) be truly undecided about whether “it is wrong to pay for sex”? Second, and even more doubtful, could it be that 30% of the people at the debate were undecided–thus had not heard arguments in let’s say the previous 10 years that converted them one way or the other–but on that very night a majority of the undecided were at last pushed into the decided camp? I think not, thus I think lying best explains the data.
Some questions for readers. Can you think of another hypothesis to explain the data? Can you think of a way of testing competing hypotheses? And does anyone know of a larger database of debate decisions with ayes, nayes and undecided before and after?
Hat tip to Robin for suggesting that there might be a tendency to 50:50, Bryan and Tyler for discussion and Robin for collecting the data.