Murders per gun, which countries have the most and least
This is a lengthy email from an MR reader who wishes to remain anonymous. These are his words, not mine, everything which follows:
Back in December I asked you knew of any naive measures of “gun murders / # of civilian guns” per country, and seeing where the US falls in this distribution.
Some time after I found this WaPo data set compiled in 2012 from the UN, Small Arms Survey, and others. (There is a “data caveat” I’ll point out after the plots below.)
Here’s what I did: dropped all data into a spreadsheet and calculated the number of homicides per 100,000 guns — simply (homicide by gun) / (total guns) * 100000. Call this “H” for simplicity.
This produces numbers in a ~0-20 range for “western countries. So “H = 2.5” –> 2.5 gun-caused homicides per 100,000 guns for the year in question (2005 I believe), by country.
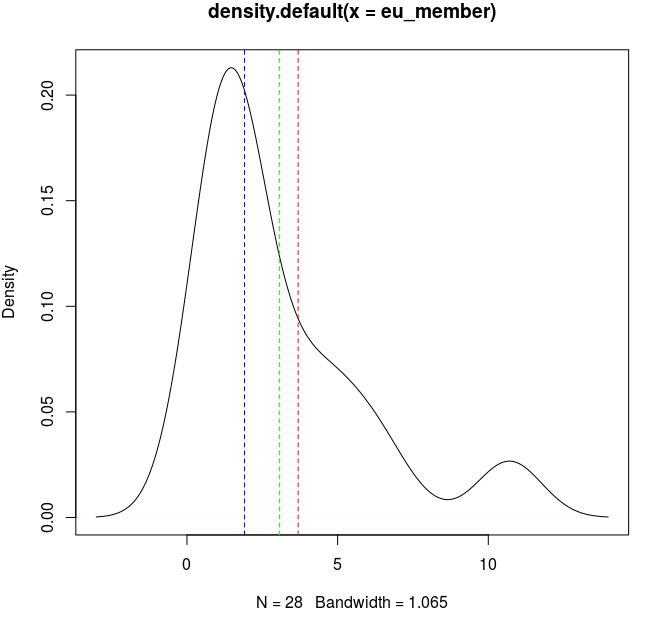
Here are three very quick, ugly kernel density plots from R.
The raw data plots is pasted in the end of the email (apologies for messyness!)
The vertical lines are: mean=green, median=blue, USA=red.
Total world, as a limiting case:
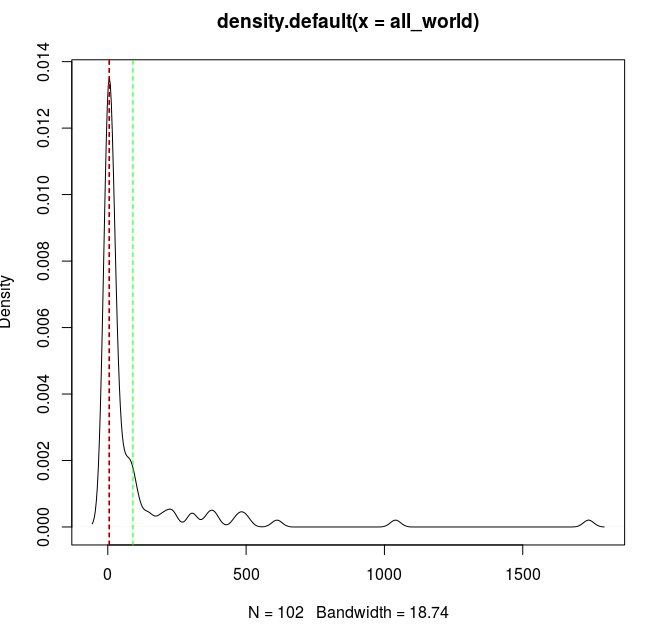
US is below mean and median: US = 3.7, mean = 91.0, median = 6.0
EU countries (density excludes US):
US is just above mean, above median: US = 3.7, mean = 3.1, median = 1.9
“Post-WWII westernized” countries:
US is just above mean, above median: US = 3.7, mean = 3.1, median = 1.5
The “westernized” countries were somewhat arbitrarily those with a long “westernizing” history post-WWII. Chosen quite ad-hoc and off-the-cuff; largely it means Eastern European countries were replaced by Canada, Australia, Japan, etc.
Immediate data caveat: My earlier spot-checking against the cited sources turned up a number of discrepancies, which I couldn’t quickly figure out — mostly small, some large. Eg. I recall that some EU countries saw order-of-magnitude differences when I put in “direct from source” numbers, which is worrisome. Unfortunately I never had time to examine these further (hence the delay in reply), but perhaps some enterprising undergraduate student would be interested!
The broad strokes are still interesting. Here are some quick ‘surprises’ for me:
– The US is no longer a massive outlier, although still above average for “westernized” plots.
– Japan’s H-score is much higher I expected, ~10x the number in Norway (and higher than England, Northern Ireland, Czech Republic – the later has much less strict control and lower H).
– The Netherlands came out ~6-7x higher than median (of EU/”westernized”); ~3x the US
– Taiwan seems quite high: ~11x median of “westernized,” ~5x US. Was not expecting this (but not sure why).
– Ireland is ~4.5x higher than Northern Ireland
– Belgium is closest to the US in the EU states, Belgium=3.9 vs US=3.7
– All surprises, perhaps all data size related: Denmark, Netherlands, Japan, Taiwan, Ireland, Italy (higher than US, was not expecting that), Belgium, Luxembourg
There are many possible data concerns. Sample size is very important (the few data I spot-checked varied significantly over time). Measurement is almost certainly an issue, and I dread looking into differences in the definition of “homicide” for these countries. I suspect, however, that clever methods and data collection could still provide useful information about ranges of these values (an enterprising undergrad could probably make quite the impact with careful data examination/collection and some Bayesian “Locomotive Problem“-style work).
Because of data issues, I don’t think of this as “the final word” but rather an interesting first pass.