Substitutes Are Everywhere: The Great German Gas Debate in Retrospect
In March of 2022 a group of top economists released a paper analyzing the economic effects on Germany of a stop in energy imports from Russia (Bachmann et al. 2022). Using a large multi-sector mathematical model the authors concluded that if prices were allowed to adjust, even a substantial shock would have relatively low costs. In contrast, the German chancellor warned that if the Russians stopped selling oil to Germany “entire branches of industry would have to shut down” and when asked about the economic models he argued that:
[the economists] get it wrong! And it’s honestly irresponsible to calculate around with some mathematical models that then don’t really work. I don’t know absolutely anyone in business who doesn’t know for sure that these would be the consequences.
The Chancellor was not alone in predicting big economic losses; some studies estimated reductions in output of 6-12% and millions of unemployed workers. The key distinction between the economists and the others was in their understanding of elasticities of substitution. When the Chancellor and the average person think about a 40% reduction in natural gas supplies, they implicitly assume that each natural gas-dependent industry must cut its usage by 40%. They then consider the resulting decline in output and the cascading effects on downstream industries. It’s easy to get very worried using this framework.
When the economists replied that there were opportunities for substitution they were typically met with disbelief and misunderstanding. The disbelief stemmed from a lack of appreciation of the many opportunities for substitution that permeate an economy. In our textbook, Modern Principles, Tyler and I explain how the OPEC oil shock in the 1970s led to an increase in brick driveways (replacing asphalt) and the expansion of sugar cane plantations in Brazil (for ethanol production). Amazingly, the oil shock also prompted flower growers to move production overseas, as the reduction in heating oil costs from growing in sunnier climates outweighed the increase in transportation fuel expenses. While these examples highlight long-term changes, short-term substitutions are also possible, though their precise details are usually hidden from central planners and economists.
 The misunderstanding came from thinking that we need every user of fuel to find substitutes. Not at all! In reality, as fuel prices rise, those with the lowest substitution costs will switch first, freeing up fuel for users who have more difficulty finding alternatives. Just one industry with favorable substitution possibilities, combined with a few moderately adaptable industries, can produce a significant overall effect. Moreover, there are nearly always some industries with viable substitution options. To see why reverse the usual story and ask, if fuel prices fell by 50% could your industry use more fuel? And if fuel prices fell by 50% are their industries that could switch into the now cheaper fuel?
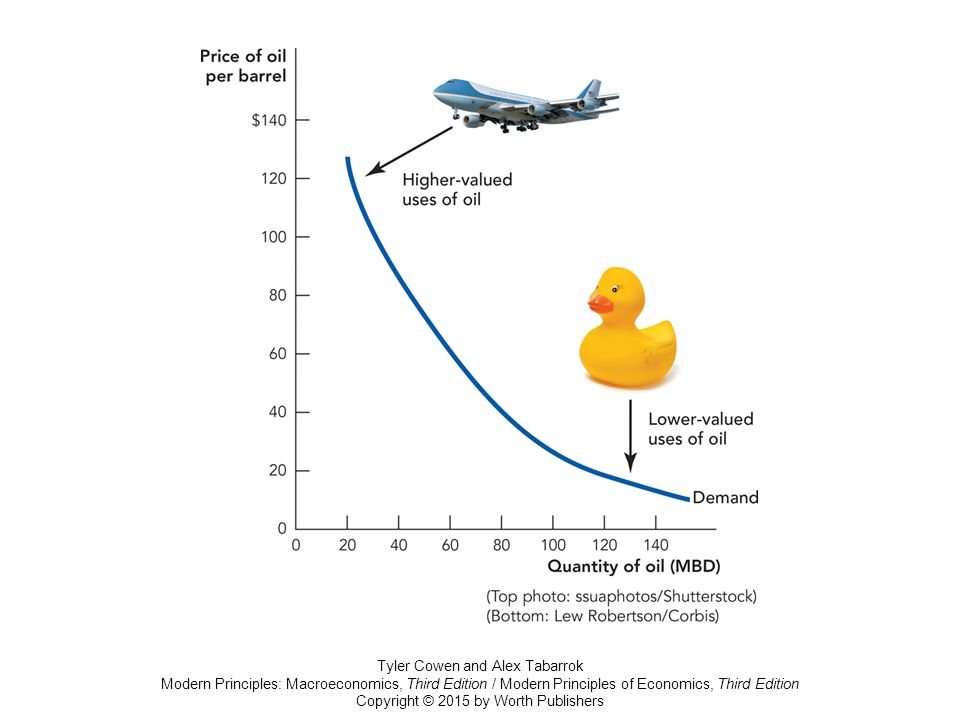
People often find it easier to imagine new uses rather than ways to reduce existing consumption. However, it is typically the new uses that are scaled back first. Tyler and I illustrate this with our jet and rubber ducky graph. Although jet aircraft won’t shift away from oil even at high prices, rubber (actually plastic) duckies, which are made from oil, can find substitutes–wood, for example–when oil prices rise. And if plastic ducky manufacturers cannot find substitutes, they go out of business, freeing up more oil for other uses. In this way, the market identifies the least valuable goods to cease production, another kind of substitution.
Substitution is a more nuanced concept than many people imagine. Here’s another example. Imagine that an economy has an energy-intensive goods producing sector and that there are few substitutes for the fuel used in this sector. Disaster? Not at all. We don’t need a fuel substitute, if we can substitute imports of the energy-intensive goods for domestically produced versions. Storage is also a substitute and notice that the more you substitute away from a fuel in final uses the greater the effective storage. If you use 1 gallon a day a 10 gallon tank lasts 10 days. If you use a quarter gallon a day it lasts 40 days. Everything is connected.
All of these myriad changes happen under the guidance of the invisible hand, i.e. the price system. Remember, a price is a signal wrapped up in an incentive. Thus Bachmann et al. wisely recommended letting energy prices rise to convey the signal and not insuring energy users so the incentive effects were fully felt on the margin.
So what happened? Gas from Russia was indeed cut very substantially but the German economy did not collapse and instead proved as robust as predicted, perhaps even more so. (The Chancellor’s predictions were off the mark but, to be fair, the government also did do a good job in sourcing new supplies and building reserves.) Moll, Schularick, and Zachmann have revisited the analysis and conclude:
The economic outcomes confirm the core theoretical argument that macro elasticities are larger than micro elasticities and that “cascading effects” along the supply chain would be muted as opposed to destroying the economy’s entire industrial sector. As foreseen, producers partly switched to other fuels or fuel suppliers, imported products with high energy content, while households adjusted their consumption patterns….Market economies have a tremendous ability to adapt that was widely underestimated. In addition, the German economics ministry (BMWK) was very successful in quickly sourcing gas supplies from third countries and building LNG capacity. Finally, it probably helped that German policymakers refrained from imposing a price cap on natural gas (like in many other European countries) and instead opted for lumpsum transfers based on households’ and firms’ historical gas consumption.
Hat tip: Alex Wollman.