Month: April 2020
Assorted non-Covid links
1. Bad trade and the loss of variety.
2. Can money buy happiness revisited: the new take is to hire a happiness agent.
3. Do people have a bias for low-deductible insurance? (yes, partly for peace of mind reasons)
4. Weird Phillips curve behavior has to do with costs, not degree of tightness in the labor market.
5. New results on Harvard discrimination against Asian-Americans. “Asian Americans are substantially stronger than whites on the observables associated with admissions…the richness of the data yields a model that predicts admissions extremely well. Our preferred model shows that AsianAmericans would be admitted at a rate 19% higher absent this penalty.”
6. New Devon Zuegel podcast with Alain and Marie-Agnes Bertaud.
What should we believe and not believe about R?
This is from my email, highly recommended, and I will not apply further indentation:
“Although there’s a lot of pre-peer-reviewed and strongly-incorrect work out there, I’ll single out Kevin Systrom’s rt.live as being deeply problematic. Estimating R from noisy real-world data when you don’t know the underlying model is fundamentally difficult, but a minimal baseline capability is to get sign(R-1) right (at least when |R-1| isn’t small), and rt.live is going to often be badly (and confidently) wrong about that because it fails to account for how the confirmed count data it’s based on is noisy enough to be mostly garbage. (Many serious modelers have given up on case counts and just model death counts.) For an obvious example, consider their graph for WA: it’s deeply implausible on its face that WA had R=.24 on 10 April and R=1.4 on 17 April. (In an epidemiological model with fixed waiting times, the implication would be that infectious people started interacting with non-infectious people five times as often over the course of a week with no policy changes.) Digging into the data and the math, you can see that a few days of falling case counts will make the system confident of a very low R, and a few days of rising counts will make it confident of a very high one, but we know from other sources that both can and do happen due to changes in test and test processing availability. (There are additional serious methodological problems with rt.live, but trying to nowcast R from observed case counts is already garbage-in so will be garbage-out.)
However, folks are (understandably, given the difficulty and the rush) missing a lot of harder stuff too. You linked a study and wrote “Good and extensive west coast Kaiser data set, and further evidence that R doesn’t fall nearly as much as you might wish for.” We read the study tonight, and the data set seems great and important, but we don’t buy the claims about R at all — we think there are major statistical issues. (I could go into it if you want, although it’s fairly subtle, and of course there’s some chance that *we’re* wrong…)
Ultimately, the models and statistics in the field aren’t designed to handle rapidly changing R, and everything is made much worse by the massive inconsistencies in the observed data. R itself is a surprisingly subtle concept (especially in changing systems): for instance, rt.live uses a simple relationship between R and the observed rate of growth, but their claimed relationship only holds for the simplest SIR model (not epidemiologically plausible at all for COVID-19), and it has as an input the median serial interval, which is also substantially uncertain for COVID-19 (they treat it as a known constant). These things make it easy to badly missestimate R. Usually these errors pull or push R away from 1 — rt.live would at least get sign(R – 1) right if their data weren’t garbage and they fixed other statistical problems — but of course getting sign(R – 1) right is a low bar, it’s just figuring out whether what you’re observing is growing or shrinking. Many folks would actually be better off not trying to forecast R and just looking carefully at whether they believe the thing they’re observing is growing or shrinking and how quickly.
All that said, the growing (not total, but mostly shared) consensus among both folks I’ve talked to inside Google and with academic epidemiologists who are thinking hard about this is:
- Lockdowns, including Western-style lockdowns, very likely drive R substantially below 1 (say .7 or lower), even without perfect compliance. Best evidence is the daily death graphs from Italy, Spain, and probably France (their data’s a mess): those were some non-perfect lockdowns (compared to China), and you see a clear peak followed by a clear decline after basically one time constant (people who died at peak were getting infected right around the lockdown). If R was > 1 you’d see exponential growth up to herd immunity, if R was 0.9 you’d see a much bigger and later peak (there’s a lot of momentum in these systems). This is good news if true (and we think it’s probably true), since it means there’s at least some room to relax policy while keeping things under control. Another implication is the “first wave” is going to end over the next month-ish, as IHME and UTexas (my preferred public deaths forecaster; they don’t do R) predict.
- Cases are of course massively undercounted, but the weight of evidence is that they’re *probably* not *so* massively undercounted that we’re anywhere near herd immunity (though this would of course be great news). Looking at Iceland, Diamond Princess, the other studies, the flaws in the Stanford study, we’re very likely still at < ~2-3% infected in the US. (25% in large parts of NYC wouldn’t be a shock though).
Anyways, I guess my single biggest point is that if you see a result that says something about R, there’s a very good chance it’s just mathematically broken or observationally broken and isn’t actually saying that thing at all.”
That is all from Rif A. Saurous, Research Director at Google, currently working on COVID-19 modeling.
Currently it seems to me that those are the smartest and best informed views “out there,” so at least for now they are my views too.
Monday assorted links
2. An extensive and pretty devastating article on the testing fail of the CDC. Again, our regulatory state has been failing us. And coverage from the NYT.
3. At the margin: “Results show that informants were given approximately 70 East German marks worth of rewards more per year in the areas that had access to WGTV, as compared with areas with no reception—ironically an amount roughly equivalent to the cost of an annual East German TV subscription.”
4. “Bars and Restaurants Peel Cash From Walls to Help Idled Workers” (NYT).
5. Scott Sumner watch the islands. This piece seems to imply that in-migration is a major source of heterogeneity. I’ve also been receiving some emails from Xavier suggested tourist inflow is a major cause of heterogeneity, due to an ever fresh supply of hard to trace cases. No rigorous test yet of that one, but it is certainly in the running as a hypothesis. And if true, it suggests many parts of Africa may not be hit that hard.
6. Karlson, Stern, and Klein on Sweden.
7. South Africa and HIV/AIDS: will the latter have been good training for Covid-19? (Economist)
8. The danger of “herd immunity overshoot.”
9. Singapore government and the Virus Vanguard.
10. Beloit University moves to more flexible two-course module system. For now at least.
Lockdown socialism will collapse
Under Lockdown Socialism:
–you can stay in your residence, but paying rent or paying your mortgage is optional.
–you can obtain groceries and shop on line, but having a job is optional.
–other people work at farms, factories, and distribution services to make sure that you have food on the table, but you can sit at home waiting for a vaccine.
–people still work in nursing homes that have lost so many patients that they no longer have enough revenue to make payroll.
–professors and teachers are paid even though schools are shut down.
–police protect your property even though they are at risk for catching the virus and criminals are being set free.
–state and local governments will continue paying employees even though sales tax revenue has collapsed.
–if you own a small business, you don’t need revenue, because the government will keep sending checks.
–if you own shares in an airline, a bank, or other fragile corporations, don’t worry, the Treasury will work something out.
This might not be sustainable.
That is from Arnold Kling. Too many of our elites are a little shy about pushing this message out there.
More simple economics of a pandemic
The difference in value to society of getting a vaccine in May 2021 vs March 2022 is huge, but the difference in private profits is not
That is from Luis Pedro Coelho. And thus there is a great import to accelerating speed, at least in some critical matters.
Brad DeLong makes the point that if you have some downward nominal (or real?) rigidities, you should allow prices to rise in the expanding sectors all the more.
So many of the most important points of economics can be expressed succintly, which makes it well-suited for both blogs and Twitter.
That’s all!
Which relocations can reopen first?
Here is a new paper by Seth Benzell, Avinash Collis, and Christos Nicolaides:
To prevent the spread of COVID-19, some types of stores and gathering places have been shut down while others remain open. The decision to shut down one type of location and leave another open constitutes a judgement about the relative danger and benefits of those locations. Using location data from a large sample of smartphones, nationally representative consumer preference surveys, and government statistics, we measure the relative transmission risk benefit and social cost of closing 30 different location categories in the US. Our categories include types of shops, schools, entertainments, and public spaces. We rank categories by those which should face stricter regulation via dominance across eight dimensions of risk and importance and through composite indexes. We find that from February to March, there were larger declines in visits to locations that our measures imply should be closed first. We hope this analysis will help policymakers decide how to reopen their economies.
Here is a summary picture:
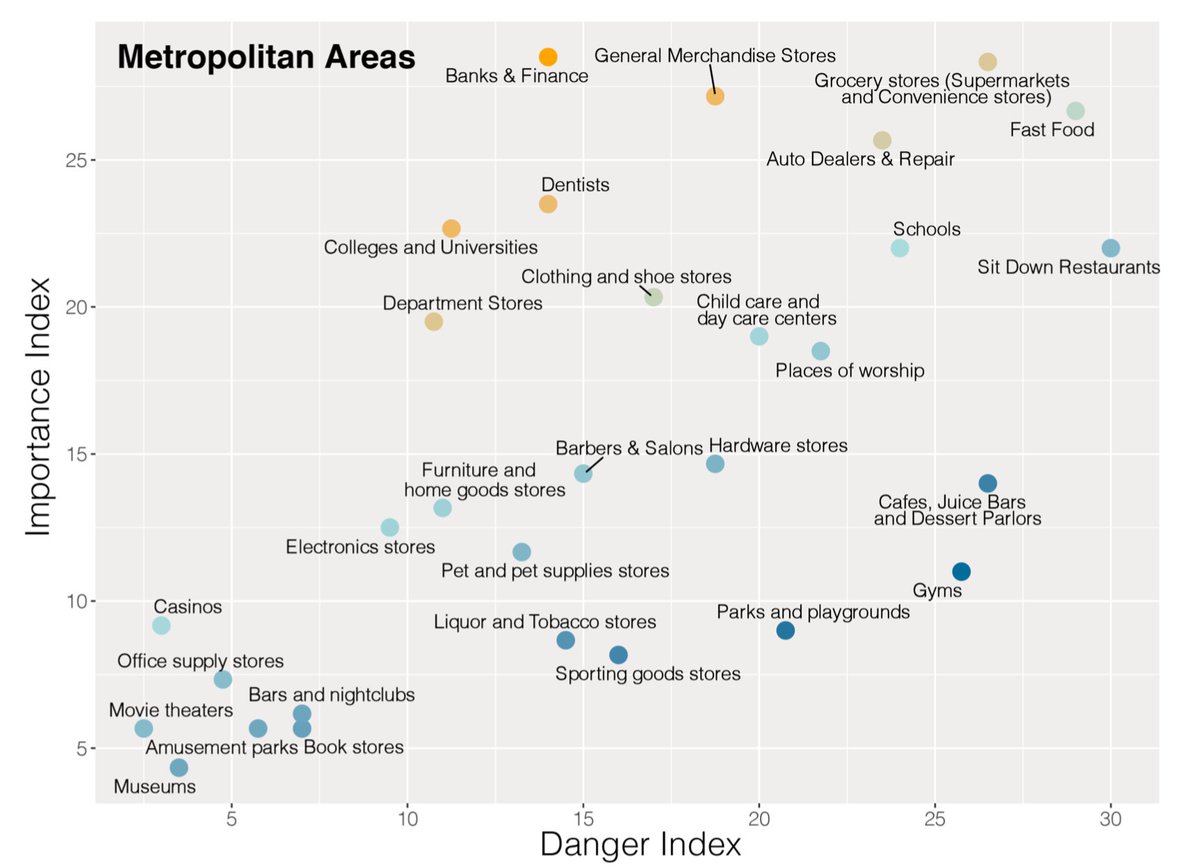
MOMA take note!
Obviously such rankings are somewhat speculative, but sooner or later some kind of disaggregated road map like this is going to be necessary. And I would say sooner.
Swedish expert against lockdowns
Here is Johan Giesecke, Swedish epidemiologist, interviewed by Freddie Sayers for a little over half an hour, one of the most interesting set pieces I have heard this year. “I’m going to tell you what I really think. I don’t usually do that.” He also gives his account of what Sweden did right and wrong, and he argues that more Swedes than Norwegians have died because a) Sweden has much larger nursing homes, and b) Swedish immigrants. How he puts matters is of great interest as well.
It is a good exercise to figure out exactly where and why his claims might be wrong. For a start, I don’t think his extreme claims about fatality and infection rates can be true, even if you agree with much of what he says.
Via Adam.
And from the excellent Samir Varma here is a new Bloomberg article about the Swedes claiming success.
Partial list of gift recipients from Fast Grants, Emergent Ventures, against Covid-19
Here is part of the list of winners, there are more to follow soon, and I am happy to cite Mercatus Center, George Mason University as home to the project.
I would again like to thank everyone who helped to make this possible, most of all those who have offered very generous financial support.
To date Fast Grants has made 67 awards to support biomedical research. Fast Grants did not exist as recently as twelve days ago and it already has distributed more than $12 million.
Sunday assorted links
1. Profile of Amy Finkelstein.
2. 1/3 test positive in a semi-random Chelsea, Mass. sample. And “Notably, 43.2% (95% CI 32.2-54.7%) of the confirmed SARS-CoV-2 infections detected across the two surveys were asymptomatic.” That is from northern Italy. and a further critique of the Santa Clara study.
3. Droplet more significant transmission than aerosol?
5. “According to the Navy, the classroom antics had a darker side.”
6. The new Magnus Carlsen tournament. And new @pmarca book recommendations.
7. NYT survey piece on heterogeneities.
8. Good and extensive west coast Kaiser data set, and further evidence that R doesn’t fall nearly as much as you might wish for. If you are advocating an extended lockdown, you really need to think this one through and present your reasoning. So far I don’t see enough people doing that, nothing close, including the economists maybe even especially the economists. Right now this is one of the biggest deficiencies in the debate.
9. Countries that have banned alcohol as part of their Covid-19 response. It is striking to me how accepting the American coastal intelligentsia is of a strict lockdown, yet a permanent ban on alcohol is to them an unacceptable idea, curtailing basic liberties and impractical.
10. “…stay-at-home orders caused people to stay at home: county-level measures of mobility declined by between 9% and 13% by the day after the stay-at-home order went into effect.” And: “We show that COVID-19 as a whole reduced consumer spending in a panel of over 1 million small businesses by 40% year-over-year. Conversely, COVID-19 did not affect aggregate consumer spending at 3,600 large businesses.3…Consumer spending at the brick-and mortar stores of large firms fell by 9%, but online transactions at these large firms increased by 56%.”
11. All this debt during a global recession is in fact dangerous.
12. William Hanage and Helen Jenkins at WaPo cover the IHME model with some seriousness. Good piece, but we should have been debating this six weeks ago or more.
13. Andrew Gelman on the Santa Clara study (brutal).
COVID Prevalence and the Difficult Statistics of Rare Events
In a post titled Defensive Gun Use and the Difficult Statistics of Rare Events I pointed out that it’s very easy to go wrong when estimating rare events.
Since defensive gun use is relatively uncommon under any reasonable scenario there are many more opportunities to miscode in a way that inflates defensive gun use than there are ways to miscode in a way that deflates defensive gun use.
Imagine, for example, that the true rate of defensive gun use is not 1% but .1%. At the same time, imagine that 1% of all people are liars. Thus, in a survey of 10,000 people, there will be 100 liars. On average, 99.9 (~100) of the liars will say that they used a gun defensively when they did not and .1 of the liars will say that they did not use a gun defensively when they did. Of the 9900 people who report truthfully, approximately 10 will report a defensive gun use and 9890 will report no defensive gun use. Adding it up, the survey will find a defensive gun use rate of approximately (100+10)/10000=1.1%, i.e. more than ten times higher than the actual rate of .1%!
Epidemiologist Trevor Bedford points out that a similar problem applies to tests of COVID-19 when prevalence is low. The recent Santa Clara study found a 1.5% rate of antibodies to COVID-19. The authors assume a false positive rate of just .005 and a false negative rate of ~.8. Thus, if you test 1000 individuals ~5 will show up as having antibodies when they actually don’t and x*.8 will show up as having antibodies when they actually do and since (5+x*.8)/1000=.015 then x=12.5 so the true rate is 12.5/1000=1.25%, thus the reported rate is pretty close to the true rate. (The authors then inflate their numbers up for population weighting which I am ignoring). On the other hand, suppose that the false positive rate is .015 which is still very low and not implausible then we can easily have ~15/1000=1.5% showing up as having antibodies to COVID when none of them in fact do, i.e. all of the result could be due to test error.
In other words, when the event is rare the potential error in the test can easily dominate the results of the test.
Addendum: For those playing at home, Bedford uses sensitivity and specificity while I am more used to thinking about false positive and false negative rates and I simplify the numbers slightly .8 instead of his .803 and so forth but the point is the same.
More on economists and epidemiologists
From my email box, here are perspectives from people in the world of epidemiology, the first being from Jacob Oppenheim:
I’d note that epidemiology is the field that has most embraced novel and principles-driven approaches to causal inference (eg those of Judea Pearl etc). Pearl’s cluster is at UCLA; there’s one at Berkeley, and another at Harvard.
The one at Harvard simultaneously developed causal methodologies in the ’70s (eg around Rubin), then a parallel approach to Pearl in the ’80s (James Robins and others), leading to a large collection of important epi people at HSPH (Miguel Hernan, etc). Many of these methods are barely touched in economics, which is unfortunate given their power in causal inference in medicine, disease, and environmental health.
These methods and scientists are very influential not only in public health / traditional epi, but throughout the biopharma and machine learning worlds. Certainly, in my day job running data science + ml in biotech, many of us would consider well trained epidemiologists from these top schools among the best in the world for quantitative modeling, especially where causality is involved.
From Julien SL:
I’m not an epidemiologist per se, but I think my background gives me some inputs into that discussion. I have a master in Mechatronics/Robotics Engineering, a master in Management Science, and an MBA. However, in the last ten years, epidemiology (and epidemiology forecasting) has figured heavily in my work as a consultant for the pharma industry.
[some data on most of epidemiology not being about pandemic forecasting]…
The result of the neglect of pandemics epidemiology is that there is precious little expertise in pandemics forecasting and prevention. The FIR model (and it’s variants) that we see a lot these days is a good teaching aid. Still, it’s not practically useful: you can’t fit exponentials with unstable or noisy parameters and expect good predictions. The only way to use R0 is qualitatively. When I saw the first R0 and mortality estimates back in January, I thought “this is going to be bad,” then sold my liquid assets, bought gold, and naked puts on indices. I confess that I didn’t expect it to be quite as bad as what actually happened, or I would have bought more put options.
…here are a few tentative answers about your “rude questions:”
a. As a class of scientists, how much are epidemiologists paid? Is good or bad news better for their salaries?
Glassdoor data show that epidemiologists in the US are paid $63,911 on average. CDC and FDA both pay better ($98k and $120k), as well as pharma (Merck: $94k-$115k). As explained above, most are working on cancer, diabetes, etc. So I’m not sure what “bad news” would be for them.

b. How smart are they? What are their average GRE scores?
I’m not sure where you could get data to answer that question. I know that in pharma, many – maybe most – people who work on epidemiology forecasting don’t have an epidemiology degree. They can have any type of STEM degree, including engineering, economics, etc. So my base rate answer would be average of all STEM GRE scores. [TC: Here are U. Maryland stats for public health students.]
c. Are they hired into thick, liquid academic and institutional markets? And how meritocratic are those markets?
Compared to who? Epidemiology is a smaller community than economics, so you should find less liquidity. Pharma companies are heavily clustered into few geographies (New Jersey, Basel in Switzerland, Cambridge in the UK, etc.) so private-sector jobs aren’t an option for many epidemiologists.
d. What is their overall track record on predictions, whether before or during this crisis?
CDC has been running flu forecasting challenges every year for years. From what I’ve seen, the models perform reasonably well. It should be noted that those models would seem very familiar to an econometric forecaster: the same time series tools are used in both disciplines. [TC: to be clear, I meant prediction of new pandemics and how they unfold]
e. On average, what is the political orientation of epidemiologists? And compared to other academics? Which social welfare function do they use when they make non-trivial recommendations?
Hard to say. Academics lean left, but medical doctors and other healthcare professionals often lean right. There is a conservative bias to medicine, maybe due to the “primo, non nocere” imperative. We see that bias at play in the hydroxychloroquine debate. Most health authorities are reluctant to push – or even allow – a treatment option before they see overwhelming positive proof, even when the emergency should encourage faster decision making.
…g. How well do they understand how to model uncertainty of forecasts, relative to say what a top econometrician would know?
As I mentioned above, forecasting is far from the main focus of epidemiology. However, epidemiologists as a whole don’t seem to be bad statisticians. Judea Pearl has been saying for years that epidemiologists are ahead of econometricians, at least when it comes to applying his own Structural Causal Model framework… (Oldish) link: http://causality.cs.ucla.edu/blog/index.php/2014/10/27/are-economists-smarter-than-epidemiologists-comments-on-imbenss-recent-paper/
I’ve seen a similar pattern with the adoption of agent-based models (common in epidemiology, marginal in economics). Maybe epidemiologists are faster to take up new tools than economists (which maybe also give a hint about point e?)
h. Are there “zombie epidemiologists” in the manner that Paul Krugman charges there are “zombie economists”? If so, what do you have to do to earn that designation? And are the zombies sometimes right, or right on some issues? How meta-rational are those who allege zombie-ism?
I don’t think so. Epidemiology seems less political than economy. There are no equivalents to Smith, Karl Marx, Hayek, etc.
i. How many of them have studied Philip Tetlock’s work on forecasting?
Probably not many, given that their focus isn’t forecasting. Conversely, I don’t think that Tetlock has paid much attention to epidemiology. On the Good Judgement website, healthcare questions of any type are very rare.
And here is Ruben Conner:
Weighing in on your recent questions about epidemiologists. I did my undergraduate in Economics and then went on for my Masters in Public Health (both at University of Washington). I worked as an epidemiologist for Doctors Without Borders and now work as a consultant at the World Bank (a place mostly run by economists). I’ve had a chance to move between the worlds and I see a few key differences between economists and epidemiologists:
-
Trust in data: Like the previous poster said, epidemiologists recognize that “data is limited and often inaccurate.” This is really drilled into the epidemiologist training – initial data collection can have various problems and surveys are not always representative of the whole population. Epidemiologists worry about genuine errors in the underlying data. Economists seem to think more about model bias.
-
Focus on implementation: Epidemiologists expect to be part of the response and to deal with organizing data as it comes in. This isn’t a glamorous process. In addition, the government response can be well executed or poorly run and epidemiologists like to be involved in these details of planning. The knowledge here is practical and hands-on. (Epidemiologists probably could do with more training on organizational management, they’re not always great at this.)
-
Belief in models: Epidemiologists tend to be skeptical of fancy models. This could be because they have less advanced quantitative training. But it could also be because they don’t have total faith in the underlying data (as noted above) and therefore see fancy specifications as more likely to obscure the truth than reveal it. Economists often seem to want to fit the data to a particular theory – my impression is that they like thinking in the abstract and applying known theories to their observations.
As with most fields, I think both sides have something to learn from each other! There will be a need to work together as we weigh the economic impacts of suppression strategies. This is particularly crucial in low-income places like India, where the disease suppression strategies will be tremendously costly for people’s daily existence and ability to earn a living.
Here is a 2014 blog post on earlier spats between economists and epidemiologists. Here is more from Joseph on that topic.
And here is from an email from epidemiologist Dylan Green:
So with that…on to the modelers! I’ll merely point out a few important details on modeling which I haven’t seen in response to you yet. First, the urgency with which policy makers are asking for information is tremendous. I’ve been asked to generate modeling results in a matter of weeks (in a disease which I/we know very little about) which I previously would have done over the course of several months, with structured input and validation from collaborators on a disease I have studied for a decade. This ultimately leads to simpler rather than more complicated efforts, as well as difficult decisions in assumptions and parameterization. We do not have the luxury of waiting for better information or improvements in design, even if it takes a matter of days.
Another complicated detail is the publicity of COVID-19 projections. In other arenas (HIV, TB, malaria) model results are generated all the time, from hundreds of research groups, and probably <1% of the population will ever see these figures. Modeling and governance of models of these diseases is advanced. There are well organized consortia who regularly meet to present and compare findings, critically appraise methods, elegantly present uncertainty, and have deep insights into policy implications. In HIV for example, models are routinely parameterized to predict policy impact, and are ex-post validated against empirical findings to determine the best performing models. None of this is currently in scope for COVID-19 (unfortunately), as policy makers often want a single number, not a range, and they want it immediately.
I hope for all of our sakes we will see the modeling coordination efforts in COVID-19 improve. And I ask my fellow epidemiologists to stay humble during this pandemic. For those with little specialty in communicable disease, it is okay to say “this isn’t my area of expertise and I don’t have the answers”. I think there has been too much hubris in the “I-told-ya-so” from people who “said this would happen”, or in knowing the obvious optimal policy. This disease continues to surprise us, and we are learning every day. We must be careful in how we communicate our certainty to policy makers and the public, lest we lose their trust when we are inevitably wrong. I suspect this is something that economists can likely teach us from experience.
One British epidemiologist wrote me and told me they are basically all socialists in the literal sense of the term. not just leaning to the left.
Another person in the area wrote me this:
Another issue that isn’t spoken about a lot is most Epidemiologists are funded by soft money. It makes them terrifyingly hard working but it also makes them worried about making enemies. Every critic now will be reviewed by someone in IHME at some point in an NIH study section, whereas IHME, funded by the Gates Foundation, has a lot of resilience. It makes for a very muted culture of criticism.Ironically, outsiders (like economist Noah Haber) trying to push up the methods are more likely to be attacked because they are not a part of the constant funding cycle.I wonder if economists have ever looked at the potential perverse incentives of being fully grant funded on academic criticism?
Here is an earlier email response I reproduced, here is my original blog post, here is my update from yesterday.
It’s Time to Build — Marc Andreessen reemerges
Here is the short essay, opening excerpt:
Every Western institution was unprepared for the coronavirus pandemic, despite many prior warnings. This monumental failure of institutional effectiveness will reverberate for the rest of the decade, but it’s not too early to ask why, and what we need to do about it.
Many of us would like to pin the cause on one political party or another, on one government or another. But the harsh reality is that it all failed — no Western country, or state, or city was prepared — and despite hard work and often extraordinary sacrifice by many people within these institutions. So the problem runs deeper than your favorite political opponent or your home nation.
Part of the problem is clearly foresight, a failure of imagination. But the other part of the problem is what we didn’t *do* in advance, and what we’re failing to do now. And that is a failure of action, and specifically our widespread inability to *build*.
We see this today with the things we urgently need but don’t have. We don’t have enough coronavirus tests, or test materials — including, amazingly, cotton swabs and common reagents. We don’t have enough ventilators, negative pressure rooms, and ICU beds. And we don’t have enough surgical masks, eye shields, and medical gowns — as I write this, New York City has put out a desperate call for rain ponchos to be used as medical gowns. Rain ponchos! In 2020! In America!
Highly recommended.
Estimating the COVID-19 Infection Rate: Anatomy of an Inference Problem
That is a recent paper by Manski and Molinari, top people with econometrics. Here is the abstract:
As a consequence of missing data on tests for infection and imperfect accuracy of tests, reported rates of population infection by the SARS CoV-2 virus are lower than actual rates of infection. Hence, reported rates of severe illness conditional on infection are higher than actual rates. Understanding the time path of the COVID-19 pandemic has been hampered by the absence of bounds on infection rates that are credible and informative. This paper explains the logical problem of bounding these rates and reports illustrative findings, using data from Illinois, New York, and Italy. We combine the data with assumptions on the infection rate in the untested population and on the accuracy of the tests that appear credible in the current context. We find that the infection rate might be substantially higher than reported. We also find that the infection fatality rate in Italy is substantially lower than reported.
Here is a very good tweet storm on their methods, excerpt: “What I love about this paper is its humility in the face of uncertainty.” And: “…rather than trying to get exact answers using strong assumptions about who opts-in for testing, the characteristics of the tests themselves, etc, they start with what we can credibly know about each to build bounds on each of these quantities of interest.”
I genuinely cannot give a coherent account of “what is going on” with Covid-19 data issues and prevalence. But at this point I think it is safe to say that the mainstream story we have been living with for some number of weeks now just isn’t holding up.
For the pointer I thank David Joslin.
Saturday assorted links
1. How to take care of your green onions.
2. New U. Texas mortality projections model. Here is an accompanying paper.
3. Spit tests seem to work pretty well relative to swabs.
5. Precht designs Parc de la Distance for outdoor social distancing.
6. “We are the neurotypicals of the COVID-19 world.”
8. A history of unemployment insurance.
9. “Outpacing the Virus: Digital Response to Containing the Spread of COVID-19 while Mitigating Privacy Risks,” by Glen Weyl, et.al.
10. They are the Chinese restaurant road trippers.
11. Measured effective reproduction numbers for various states (please note this comes with the usual data problems!). Will social distancing get these much below 0.8? I found this link to be quite pessimistic in its implications.
Pollution is an Attack on Human Capital
Here’s the latest video from MRU where I cover some interesting papers on the effect of pollution on health, cognition and productivity. The video is pre-Covid but one could also note that pollution makes Covid more dangerous. For principles of economics classes the video is a good introduction to externalities and also to causal inference, most notably the difference in difference method.
Might I also remind any instructor that Modern Principles of Economics has more high-quality resources to teach online than any other textbook.