Category: Economics
The distribution of cities, then and now
In today’s developed countries, cities are thus scattered across historically important agricultural areas; as a result, there is a relatively higher degree of spatial equality in the distribution of resources within these countries. By contrast, in today’s developing countries, cities are concentrated more on the coast where transport conditions, compared to agricultural suitability, are more favorable.
That is from Henderson, Squires, Storeygard, and Weil in the January 2018 QJE, based on light data measured by satellites. Overall, I view this regularity as a negative for the prospects for liberalism and democracy in emerging economies, as urban concentration can encourage too much rent-seeking and kleptocracy. It also reflects the truly amazing wisdom of (some of) our Founding Fathers, who saw a connection between liberty and decentralized agrarianism. It suggests a certain degree of pessimism about China’s One Belt, One Road initiative. The development of the hinterland in the United States may not be a pattern that today’s emerging economies necessarily should or could be seeking to replicate. Which makes urban economics and Henry George all the more important.
Direct Instruction: A Half Century of Research Shows Superior Results
What if I told you that there is a method of education which significantly raises achievement, has been shown to work for students of a wide range of abilities, races, and socio-economic levels and has been shown to be superior to other methods of instruction in hundreds of tests? Well, the method is Direct Instruction and I first told you about it in Heroes are Not Replicable. I am reminded of this by the just-published, The Effectiveness of Direct Instruction Curricula: A Meta-Analysis of a Half Century of Research which, based on an analysis of 328 studies using 413 study designs examining outcomes in reading, math, language, other academic subjects, and affective measures (such as self-esteem), concludes:
…Our results support earlier reviews of the DI effectiveness literature. The estimated effects were consistently positive. Most estimates would be considered medium to large using the criteria generally used in the psychological literature and substantially larger than the criterion of .25 typically used in education research (Tallmadge, 1977). Using the criteria recently suggested by Lipsey et al. (2012), 6 of the 10 baseline estimates and 8 of the 10 adjusted estimates in the reduced models would be considered huge. All but one of the remaining six estimates would be considered large. Only 1 of the 20 estimates, although positive, might be seen as educationally insignificant.
…The strong positive results were similar across the 50 years of data; in articles, dissertations, and gray literature; across different types of research designs, assessments, outcome measures, and methods of calculating effects; across different types of samples and locales, student poverty status, race-ethnicity, at-risk status, and grade; across subjects and programs; after the intervention ceased; with researchers or teachers delivering the intervention; with experimental or usual comparison programs; and when other analytic methods, a broader sample, or other control variables were used.
It is very unusual to see an educational method successfully replicate across such a long period of time and across so many different margins.
Direct Instruction was pioneered by Siegfried Engelmann in the 1960s and is a scientific approach to teaching. First, a skill such as reading or subtraction is broken down into simple components, then a method to teach that component is developed and tested in lab and field. The method must be explicitly codified and when used must be free of vagueness so students are reliably led to the correct interpretation. Materials, methods and scripts are then produced for teachers to follow very closely. Students are ability not age-grouped and no student advances before mastery. The lessons are fast-paced and feedback and assessment are quick. You can get an idea of how it works in the classroom in this Thales Academy promotional video. Here is a math lesson on counting. It looks odd but it works.
Even though Direct Instruction has been shown to work in hundreds of tests it is not widely used. It’s almost as if education is not about educating.
Some people object that DI is like mass-production. This is a feature not a bug. Mass-production is one of the few ways yet discovered to produce quality on a mass scale. Any method will probably work if a heroic teacher puts in enough blood, sweat and tears but those methods don’t scale. DI scales when used by mortals which is why it consistently beats other methods in large scale tests.
Many teachers don’t like DI when first exposed to it because it requires teacher training and discipline. Teachers are not free to make up their own lesson plans. But why should they be? Lesson plans should be developed by teams of cognitive psychologists, educational researchers and other experts who test them using randomized controlled trials; not made up by amateurs who are subject to small-sample and confirmation bias. Contrary to the critics, however, DI does leave room for teachers to be creative. Actors also follow a script but some are much better than others. Instructors who use DI enjoy being effective.
Quoting the authors of the meta-analysis:
Many current curriculum recommendations, such as those included within the Common Core, promote student-led and inquiry-based approaches with substantial ambiguity in instructional practices. The strong pattern of results presented in this article, appearing across all subject matters, student populations, settings, and age levels, should, at the least, imply a need for serious examination and reconsideration of these recommendations (see also Engelmann, 2014a; Morgan, Farkas, & Maczuga, 2015; Zhang, 2016). It is clear that students make sense of and interpret the information that they are given—but their learning is enhanced only when the information presented is explicit, logically organized, and clearly sequenced. To do anything less shirks the responsibility of effective instruction.
The twenty-page essay exam
Imagine giving all professional economists (and other academics) an essay test. Determine their area of expertise, and then ask them to write a twenty-page essay on one of the most basic questions in that field. So it might be “Why did China do so well?” Or “what are the determinants of economic growth?” Or “What causes business cycles?”
Some would be more specific, such as “What makes nominal prices sticky?”, or “Why are the special features of platform competition important?” How about “How can we encourage hospitals to compete more effectively?”
They can use some numbers, but mostly they should write out the best answers they can.
Then grade the exams.
At which universities would professors do the best? In which fields would the researchers do the best, recognizing that some face more difficult problems than do others? In which countries?
How much should our profession be focused on being able to write good answers to such questions?
I am indebted to Chris Blattman and Arnold Kling for useful exchanges related to this topic.
Chicago fact of the day
The mayhem has not spared the Cboe [Chicago Board Options Exchange], with the exchange’s share price falling by as much as 28 per cent this week. Vix futures were responsible for about 40 per cent of the exchange’s earnings growth between 2015 and 2017, according to Goldman Sachs, with ETPs accounting for roughly 20-30 per cent of the “open interest” in Vix futures in recent years.
When fiscal policy might make matters worse
From the new 4th edition of Cowen and Tabarrok, Modern Principles of Economics:
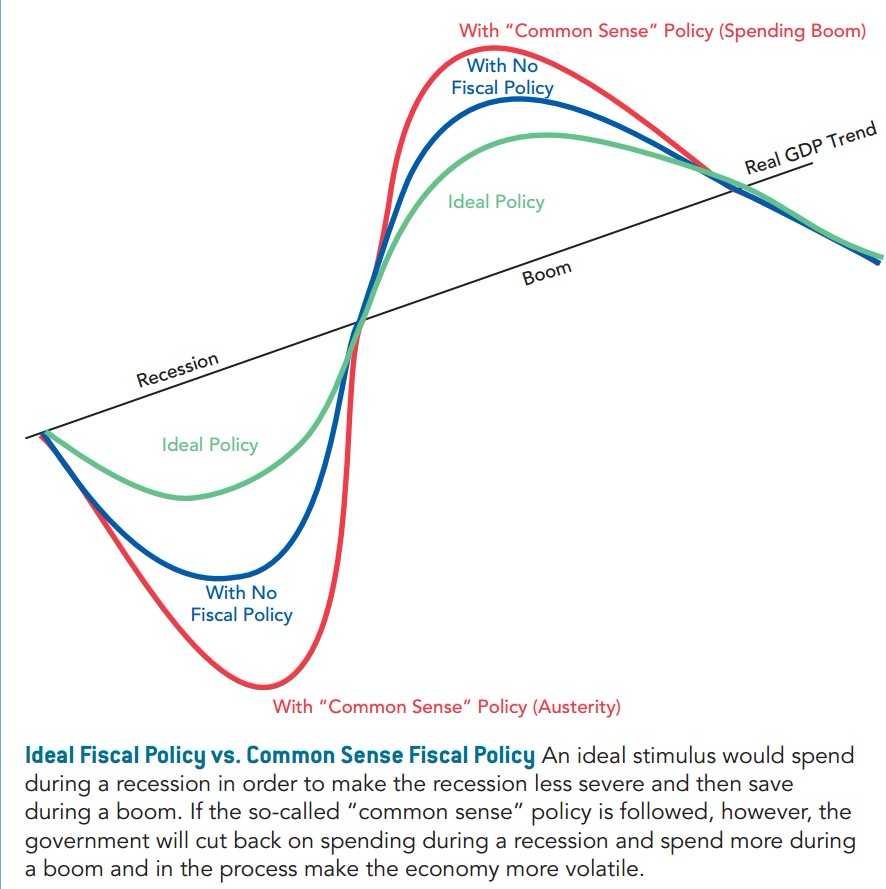
Increased spending and tax cuts have to be paid for. Thus, increased spending and tax cuts today will tend to be followed by decreased spending or tax increases tomorrow. When tomorrow comes and spending is reduced and taxes rise, aggregate demand will fall—this is one reason why long-run or net multipliers are smaller than short-run multipliers. Ideal fiscal policy will increase AD in bad times and pay off the bill in good times, as we show in Figure 37.5. Overall, if we can spend more in bad times when the multiplier is big and tax more in good times when the multiplier is small, the net effect will lead to higher GDP overall. Economists say that the ideal fiscal policy is counter-cyclical because when the economy is down the government should spend more, and when the economy is up the government should spend less.
Although counter-cyclical fiscal policy makes sense to economists, it often
doesn’t make sense to politicians or to voters. The views of economists violate a kind of “common sense” or folk wisdom, which says that in bad times the government should spend less and only in good times should the government spend more. After all, you and I spend less when times are bad and more when times are good, so shouldn’t the government behave similarly? If the government follows the “common sense” view, however, it will tend to make recessions deeper and booms larger, thereby making the economy more volatile, again as shown in Figure 37.5.
…Even when governments do spend more in recessions, as economists suggest, they often don’t follow through on the second half of the prescription, which is to spend less during booms…This usually means that there is less room for expansionary fiscal policy when it is needed.
The 4th edition is just out, here is more information.
Bias in Advertising vs Subscription Driven Media
The excellent Andrew Potter at In Due Course writes:
When I was a student journalist, it was axiomatic that advertising was the biggest threat to independent media. Putting your livelihood in the hands of capitalists meant, ipso facto, doing their bidding.
Experience is a great teacher though, and when I started working as an editor at a newspaper, I was pleasantly surprised to discover that you didn’t wake up every day to a swarm of calls from outraged advertisers threatening to pull their campaigns if we didn’t smarten up….presumably because they didn’t really care. What they wanted was our audience, not the content.
But you know who does complain a lot? Subscribers do, endlessly.
Today, the great hope for mainstream news organizations is that subscribers will start doing something they’ve never done, which is pay for news. The New York Times seems well on its way to bending that revenue curve and replacing ad dollars with subscribers at a 1:1 ratio, and there’s similar hopes for the Washington Post, the FT, and maybe the Wall Street Journal….
…My suspicion is that [this] will lead to an increasingly polarized media environment, through more or less the same mechanism that leads to group polarization in social psychology. When a news organization relies almost entirely on its readership for its revenue, it will inevitably start to cater to what the owners perceive to be the political centre of gravity of that readership. And the readership will in turn make demands on the editors to shape the coverage in certain ways, which will tend to gradually shift that centre of gravity away from the middle, and towards the political extremes.
I’d add one more factor to Potter’s analysis. Since the advertisers care about eyeballs, advertisement-funded media are incentivized to produce more eyeballs. Such incentives tends to encourage lowest-common-denominator entertainment but also more political balance. Subscription-funded media, in contrast, face a tradeoff: subscribers want content that supports their world view so moderating the content to appeal to a larger audience will likely reduce the price that any one reader is willing to pay. Revenues are therefore larger with a smaller but more political extreme audience.
Addendum: Potter and philosopher Joseph Heath write at In Due Course infrequently but are always interesting. Here, for example, is a superb long-read by Heath, nominally about Iain Bank’s culture series but actually about more and well worth reading even if you don’t know the novels.
Why is idiosyncratic stock market volatility so low?
We find that the historically low IR [idiosyncratic risk] can be explained by the changes in firm characteristics that take place since the 1990s.
…the number of listed firms has fallen dramatically and the composition of listed firms has changed considerably, with public firms becoming larger and older. We show that there is a stable relation between firm-level idiosyncratic risk and firm characteristics…we find no evidence that IR increases with institutional ownership…
That is from Bartram, Brown, and Stulz, in the NBER working paper series.
The signaling start-up culture that is Finland
Intrepid entrepreneurs have plunged into icy Finnish water in an eccentric contest to win funding for their business ideas.
Polar Bear Pitching allows start-up firms to put forward their projects to investors for as long as they can stand in the freezing temperatures.
The final of the Dragon’s Den-style competition will see a dozen companies put their plans under the noses of investors.
The winner of the two-day contest — which takes place in frozen sea near Oulu on February 6 and 7 — will receive €10,000.
Start-ups who have secured funding say standing in such cold water helps convince investors they are serious.
Here is the article and photo, via Danica Porobic.
The Uber Pay Gap
Using data on over one million Uber drivers and millions of trips, Cody Cook, Rebecca Diamond, Jonathan Hall, John A. List, and Paul Oyer show that female Uber drivers earn 7% less than male drivers. What makes this paper new, however, is that UBER’s extensive data lets the authors understand in great detail why the pay gap exists. It’s not discrimination:
Uber uses a gender-blind algorithm and drivers earn according to a transparent formula based on the time and distance of trips. There are no negotiated pay rates or convex returns to long hours worked, factors that have been shown to open a gender earnings gap in other settings. Our research also finds that both average rider ratings of drivers and cancellation rates are roughly equivalent between genders and we find no evidence that outright discrimination, either by the app or by riders, is driving the gender earnings gap.
The authors find that three factors explain the gap; driving speed, experience, and choices about where to drive.
First, driving speed alone can explain nearly half of the gender pay gap. Second, over a third of the gap
can be explained by returns to experience, a factor which is often almost impossible to evaluate
in other contexts that lack high frequency data on pay, labor supply, and output. The remaining
∼20% of the gender pay gap can be explained by choices over where to drive.
Male Uber drivers, like other males, drive a bit faster than female drivers, about 2.2% faster after controlling for experience and location. Since Uber pays by time as well as by distance the returns to speed are not very high and the difference in speed is small but overall this results in an increase in pay for males of about 50 cents an hour.
Drivers learn by doing and more men than women have driven for Uber for years:
A driver with more than 2,500 lifetime trips completed earns 14% more per hour than a driver who
has completed fewer than 100 trips in her time on the platform, in part because she learn where
to drive, when to drive, and how to strategically cancel and accept trips. Male drivers accumulate
more experience than women by driving more each week and being less likely to stop driving with
Uber.
Overall, female and male Uber drivers behave remarkably similarly but small differences aggregated over large samples produce a small but systematic gender gap in wages of about 7%. The gap, however, is an artifact, a social construct that has no implications for “social justice,” drivers are treated equally.
The author’s conclude:
Overall, our results suggest that, even in the gender-blind, transactional, flexible environment
of the gig economy, gender-based preferences (especially the value of time not spent at paid work
and, for drivers, preferences for driving speed) can open gender earnings gaps. The preference
differences that contribute to pay differences in professional markets for lawyers and MBA’s also
lead to earnings gaps for drivers on Uber, suggesting they are pervasive across the skill distribution
and whether in the traditional or gig workplace.
Valentine’s Day and Understanding the Price System
Valentine’s Day is coming up so here’s a reminder to get your loved one a present! Valentine’s is also a great time to teach your students about globalization, the signaling and incentive role of prices, and the power of the price system–all key aspects of Chapter 7 in our textbook Modern Principles of Economics. We have two superb videos to encourage understanding and discussion of the price system, I, Rose and A Price is a Signal Wrapped up in an Incentive (see below).
In addition, we have created a lesson plan with discussion prompts, exercises, practice questions, and pre- and post-class assignments. Finally, we provide supplementary resources such as additional data sources, relevant news articles and blog posts, and an episode of Planet Money. You can find all of this material in one convenient location here. Enjoy!
*Self-Regulation and Human Progress*
Note that General Motors, with both a direct incentive to closely monitor water quality and the capacity to do something about it, ceased using Flint River water at its engine plant in that city in October 2014.
The author of the book is Evan Osborne and the subtitle is How Society Gains When We Govern Less.
Title length
Abstract
We document strong and robust negative correlations between the length of the title of an economics article and different measures of scientific quality. Analyzing all articles published between 1970 and 2011 and referenced in EconLit, we find that articles with shorter titles tend to be published in better journals, to be more cited and to be more innovative. These correlations hold controlling for unobserved time-invariant and observed time-varying characteristics of teams of authors.
That is by Yann Bramoullé and Lorenzo Ductor at JEBO, via Michelle Dawson.
Why have some asset prices been so high?
Do they have to be bubbles? And is it so terrible if they fall? I cover those topics in my latest Bloomberg column, here is one bit:
In a volatile and uncertain time politically, we have observed sky-high prices for blue-chip U.S. equities. Other asset prices also seem to be remarkably high: home values and rentals in many of the world’s top-tier cities, negative real rates and sometimes negative nominal rates on the safest government securities, and the formerly skyrocketing and still quite high price of Bitcoin and other crypto-assets.
Might all of those somewhat unusual asset prices be part of a common pattern? Consider that over the past few decades there has been a remarkable increase of wealth in the world, most of all in the emerging economies. Say you hold enough wealth to invest: What are your options? Well, the stock markets of China and Russia are unsafe and not well developed, and many other emerging economies, such as Turkey and Brazil, have been wracked with uncertainty and political turmoil. So you might take a disproportionate share of your money and put it into high-quality, highly liquid assets. That might include the stocks of the Dow Jones Industrial Average and real estate in London, to name two possibilities.
In relative terms, the high-quality, highly liquid blue-chip assets will become expensive. So we end up with especially high price-to-earnings ratios and consistently negative real yields on safe government securities. Those price patterns don’t have to be bubbles. If this state of affairs persists, with a shortage of safe investment opportunities, those prices can stay high for a long time. They may go up further yet.
These high asset prices do reflect a reality of wealth creation. They are broadly bullish at the global scale, but they don’t have to demonstrate much if any good news about those assets per se. Rather there is an imbalance between world wealth and safe ways of transferring that wealth into the future…
To sum this all up in a single nerdy finance sentence, in a world where wealth creation has outraced the evolution of good institutions, the risk premium may be more important than you think.
In this “model,” price declines do not have to be disastrous, but rather can reflect a kind of normalization. Do read the whole thing. The theory also predicts that bond, equity, and Bitcoin prices should all decline at the same time, which is indeed what happened yesterday.
How much are illegal activities behind the demand for crypto-currency?
Cryptocurrencies are among the largest unregulated markets in the world. We find that approximately one-quarter of bitcoin users and one-half of bitcoin transactions are associated with illegal activity. Around $72 billion of illegal activity per year involves bitcoin, which is close to the scale of the US and European markets for illegal drugs. The illegal share of bitcoin activity declines with mainstream interest in bitcoin and with the emergence of more opaque cryptocurrencies. The techniques developed in this paper have applications in cryptocurrency surveillance. Our findings suggest that cryptocurrencies are transforming the way black markets operate by enabling “black e-commerce.”
Here is the paper, by Foley, Karlsen, and Putniņš, via the excellent Kevin Lewis.
Federal Regulation Is Not the Cause of Declining Dynamism
My paper with the excellent Nathan Goldschlag, Is regulation to blame for the decline in American entrepreneurship? has finally been published. Our paper tests the plausible theory that regulation reduces dynamism as it builds up over time. Michael Mandel explains:
…it’s possible for every individual regulation to pass a cost-benefit test, while
the total accumulation of regulation creates a heavy burden on Americans. The number of
regulations matter, even if individually all are worthwhile.I call this the ‘pebble in the stream’ effect. Thrown one pebble in the stream, nothing happens.
Throw two pebbles in the stream, nothing happens. Throw one hundred pebbles in the stream,
and you have dammed up the stream. Which pebble did the damage? It’s not any single pebble,
it’s the accumulation.
This is also the theory of regulation and declining dynamism that Mancur Olson puts forward in his classic, The Rise and Decline of Nations. We find, however, that declining dynamism cannot be explained by growing federal regulation. The reason turns out to be simple: the decline in dynamism is widespread across many different industries and, in particular, it is widespread across heavily and lightly regulated industries. Our finding does not imply that regulation is necessarily good–regulations could fail a cost-benefit test and yet not have much of an effect on dynamism–nor does it imply that no regulation could explain declining dynamism only that we should probably look elsewhere for an explanation of declining dynamism than the cumulative growth of federal regulation. See the paper for some suggestions.
Frankly, it’s difficult to publish a paper that fails to reject the null hypothesis. A positive or negative effect is a natural stopping point–ok, they got it, let’s move on–but a zero-effect always leads to  complaints that you didn’t run the regression in such and such a way or you could have done such and such a test. The asymmetry in paper evaluation leads to the file drawer problem where published results tend to reject the null even when a random sample of all results would find that the null is supported. We know the file drawer problem is serious because it predicts that studies with small sample sizes should have larger effect sizes–an effect that has often been found.
I can’t complain too much, however, because our paper was published in Economic Policy, a highly-ranked journal, and is the Editor’s Choice paper for that issue. The referees certainly made the paper better.
One of the things we did in the paper to counter the claim that our methods or data were defective was to look for entirely independent tests of the regulation hypothesis. If regulation is the main cause of declining U.S. dynamism, for example, then we ought to find that declining dynamism is associated with declining industry size. But when we look at dynamism, as measured by excess job reallocation rates, and industry employment what we see is that dynamism is declining in both shrinking and growing industries (see above). The paper has many additional tests.
The data and tools in our paper have other applications. Our methods, for example, can be used to distinguish between special-interest and general-interest regulation and could be used to test many other theories in political economy.