Category: Uncategorized
The roots of fascism in Italy, namely communism
In this paper, we argue that there was a strong link between the surge of support for the Socialist Party after World War I (WWI) and the subsequent emergence of Fascism in Italy. We first develop a source of variation in Socialist support across Italian municipalities in the 1919 election based on war casualties from the area. We show that these casualties are unrelated to a battery of political, economic and social variables before the war and had a major impact on Socialist support (partly because the Socialists were the main anti-war political movement). Our main result is that this boost to Socialist support (that is “exogenous” to the prior political leaning of the municipality) led to greater local Fascist activity as measured by local party branches and Fascist political violence (squadrismo), and to significantly larger vote share of the Fascist Party in the 1924 election. We document that the increase in the vote share of the Fascist Party was not at the expense of the Socialist Party and instead came from right-wing parties, thus supporting our interpretation that center-right and right-wing voters coalesced around the Fascist Party because of the “red scare”.
That is from a new paper by Daron Acemoglu, Giuseppe De Feo, Giacomo De Luca, and Gianluca Russo.
Friday assorted links
1. Were the experts too slow to embrace travel restrictions? (NYT) And the Covid culture that is German (short video).
2. Does personality drive moral judgement?: Polite deontologists and curious consequentialists.
3. My rewrite of this thread: doctors hate highly beneficial but somewhat inaccurate testing methods that lower their status and good feelings about themselves.
4. Further results on “dry tinder” in the Nordics: “My results show that a large share of the excess mortality in Sweden in April 2020 may be partially explained by a vulnerable, elderly population due to very mild flu seasons in 18/19 and 19/20 as well as very few deaths during the 2019 summer compared to earlier years and compared to other Nordic countries.”
5. John Cochrane on political diversity in the AEA.
The elasticity of science
By Kyle Myers:
This paper identifies the degree to which scientists are willing to change the direction of their work in exchange for resources. Data from the National Institutes of Health are used to estimate how scientists respond to targeted funding opportunities. Inducing a scientist to change their direction by a small amount—to work on marginally different topics—requires a substantial amount of funding in expectation. The switching costs of science are large. The productivity of grants is also estimated, and it appears the additional costs of targeted research may be more than offset by more productive scientists pursuing these grants.
Here is the full article in American Economic Journal: Applied Economics.
Thursday assorted links
1. Slate Star Codex now a series of hardcover books on Amazon.
2. Liberties, a new journal of culture and politics.
3. Talk/video on the new fusion developments, and more here.
4. How did the DOE’s first crop of risky energy tech do? Original research here.
5. The major genetic risk factor for severe COVID-19 is inherited from Neanderthals. And some useful context. And Peter Hessler on the Chinese vaccine (New Yorker).
Grape Economists
The latest MRU video in our series Economists in the Wild features Orley Ashenfelter talking about his research on wine. One thing I hadn’t known is that Orley used his regressions to figure out that New Jersey was actually a great place to start a vineyard, and he did! See also the results from the Judgment of Princeton.
Here’s a free assignment to help connect this video to class: https://mru.io/1a6ba
Regression analysis assignment: https://mru.io/d8194
More professor resources: http://mru.io/professor-resources-5e7df
High school teacher resources: https://mru.io/high-school-resources-27767
Seasonal coronavirus protective immunity is short-lasting
A key unsolved question in the current coronavirus disease 2019 (COVID-19) pandemic is the duration of acquired immunity. Insights from infections with the four seasonal human coronaviruses might reveal common characteristics applicable to all human coronaviruses. We monitored healthy individuals for more than 35 years and determined that reinfection with the same seasonal coronavirus occurred frequently at 12 months after infection.
That is from a new research paper by Arthur W D Edridge, et.al. That is not conclusive proof concerning Covid-19, but it’s not exactly great news either.
Fifty Shades of QE: Conflicts of Interest in Economic Research
Ho hum, nothing to see here…
Central banks sometimes evaluate their own policies. To assess the inherent conflict of interest, we compare the research findings of central bank researchers and academic economists regarding the macroeconomic effects of quantitative easing (QE). We find that central bank papers report larger effects of QE on output and inflation. Central bankers are also more likely to report significant effects of QE on output and to use more positive language in the abstract. Central bankers who report larger QE effects on output experience more favorable career outcomes. A survey of central banks reveals substantial involvement of bank management in research production.
That is a new NBER working paper by Brian Fabo, Martina Jančoková, Elisabeth Kempf, and Ľuboš Pástor. Here is very good commentary and analysis from John Cochrane.
Wednesday assorted links
1. Now they are cancelling parrots. And there is no satire anymore. Or is it Straussian?
2. Oakland airport wants to attract passengers with free rapid Covid testing.
3. Should Matt Yglesias go on the warpath against car seats?
4. Virtual work partners to help you focus.
5. Survey of the evidence on declining Covid death rates. And here is yet further evidence on the relevance of T-cells. And new Covid results from lots of Indian data (NYT).
6. 15-minute test coming to Europe (Bloomberg).
Reston, VA
The Richmond Fed has a nice review of Reston, VA and Columbia, MD, two of the first private towns in the United States.
…
Both Reston and Columbia have been consistently ranked as two of the best towns to live in the United States. One bit I didn’t know, was that both Reston and Columbia were integrated from the beginning:
Addendum: Here’s my NYTimes op-ed with Shruti Rajagopalan, Designing Private Cities Open to All.
Do algorithms collude?
Yes, in short. Emilio Calvano, Giacomo Calzolari, Vincenzo Denicolò and Sergio Pastorello cover this topic in the latest issue of the American Economic Review:
Increasingly, algorithms are supplanting human decision-makers in pricing goods and services. To analyze the possible consequences, we study experimentally the behavior of algorithms powered by Artificial Intelligence (Q-learning) in a workhorse oligopoly model of repeated price competition. We find that the algorithms consistently learn to charge supracompetitive prices, without communicating with one another. The high prices are sustained by collusive strategies with a finite phase of punishment followed by a gradual return to cooperation. This finding is robust to asymmetries in cost or demand, changes in the number of players, and various forms of uncertainty.
Here is the paper.
Where and when does herd immunity kick in?
Here is the abstract of a new paper by
We have studied the evolution of COVID-19 in 12 low and middle income countries in which reported cases have peaked and declined rapidly in the past 2-3 months. In most of these countries the declines happened while control measures were consistent or even relaxing, and without signs of significant increases in cases that might indicate second waves. For the 12 countries we studied, the hypothesis that these countries have reached herd immunity warrants serious consideration. The Reed-Frost model, perhaps the simplest description for the evolution of cases in an epidemic, with only a few constant parameters, fits the observed case data remarkably well, and yields parameter values that are reasonable. The best-fitting curves suggest that the effective basic reproduction number in these countries ranged between 1.5 and 2.0, indicating that the curve was flattened in some countries but not suppressed by pushing the reproduction number below 1. The results suggest that between 51 and 80% of the population in these countries have been infected, and that between 0.05% and 2.50% of cases have been detected; values which are consistent with findings from serological and T-cell immunity studies. The infection rates, combined with data and estimates for deaths from COVID-19, allow us to estimate overall infection fatality rates for three of the countries. The values are lower than expected from reported infection fatality rates by age, based on data from several high-income countries, and the country population by age. COVID-19 may have a lower mortality risk in these three countries (to differing degrees in each country) than in high-income countries, due to differences in immune response, prior exposure to coronaviruses, disease characteristics or other factors. We find that the herd immunity hypothesis would not have fit the evolution of reported cases in several European countries, even just after the initial peaks; and subsequent resurgences of cases obviously prove that those countries have infection rates well below herd immunity levels. Our hypothesis that the 12 countries we studied have reached herd immunity should now be tested further, through serological and T cell immunity studies.
Via Alan Goldhammer.
Addendum: From Catinthehat in the comments:
It’s a simple homogeneous model Ni(t+1)= Ni(t) * Ro * Si(t) / Ntot -> Infected at time t+1 = Infected at time t * Ro * the proportion ( of the population) susceptible at time t. where t is discretized.
They fit the step t to an infection duration , then they fit Ro, to reproduce the shape of the curve for each country and at each step they multiply the infected by a parameter p (the undetected case ratio) to fit to the total population. This acts as an accelerant to the epidemic . Each country has its own p.
The main issue is that you can look at any epidemic curve and fit it that way and you will rather automatically reproduce this high immunity threshold which comes from your homogenous model.In Europe you can’t assume the undetected ratio is so high ( 1000x to 2000 x) so you must conclude social distancing stopped the epidemic, because your strategy would not fit experimental data.
In the countries fitted , the paper must conclude the epidemic raged fairly undetected, fairly quickly and infected most of the population.
Tuesday assorted links
1. Beetle technician. Rat tickler: “it’s crucial for researchers to know whether the animals are having a positive or negative experience.”
2. No central original point here, but this paper is actually an extremely useful piece for understanding currency risk. And Captain Beefheart’s ten commandments of guitar playing.
3. “Surprisingly, we document that innovation was resilient in the face of one of the largest financial crises in the U.S. history, suggesting that it is likely to be even more so during milder economic recessions.” Link here. One plausible way of reading the result is that independent inventors were damaged, but their efforts were reallocated into firms, which improved by a result.
5. An actual scientific study of intermittent fasting suggests no real benefit and loss of muscle mass.
6. “With more of us than ever working from home during the coronavirus pandemic, there has been a spike in demand from employers for surveillance software. US-based Hubstaff says its number of UK customers is up four times year-on-year since February.” Link here.
A Calculation of the Social Returns to Innovation
Benjamin Jones and Larry Summers have an excellent new paper calculating the returns to social innovation.
This paper estimates the social returns to investments in innovation. The disparate spillovers associated with innovation, including imitation, business stealing, and intertemporal spillovers, have made calculations of the social returns difficult. Here we provide an economy-wide calculation that nets out the many spillover margins. We further assess the role of capital investment, diffusion delays, learning-by-doing, productivity mismeasurement, health outcomes, and international spillovers in assessing the average social returns. Overall, our estimates suggest that the social returns are very large. Even under conservative assumptions, innovation efforts produce social benefits that are many multiples of the investment costs.
What was interesting to me is that their methods of calculation are obvious, almost trivial. It can take very clever people to see the obvious. Essentially what they do is take the Solow model seriously. The Solow model says that in equilibrium growth in output per worker comes from productivity growth. Suppose then that productivity growth comes entirely from innovation investment then this leads to a simple expression:
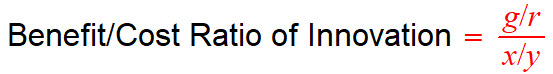 Where g is the growth rate of output per worker (say 1.8% per year), r is the discount rate (say 5%), and x/y is the ratio of innovation investment, x, to GDP, y, (say 2.7%). Plugging the associated numbers in we get a benefit to cost ratio of (.018/.05)/.027=13.3.
To see where the expression comes from suppose we are investing zero in innovation and thus not growing at all. Now imagine we invest in innovation for one year. That one year investment improves economy wide productivity by g% forever (e.g. we learn to rotate our crops). The value of that increase, in proportion to the economy, is thus g/r and the cost is x/y.
Jones and Summers then modify this simply relation to take into account other factors, some of which you have undoubtedly already thought of. Suppose, for example, that innovation must be embodied in capital, a new design for a nuclear power plant, for example, can’t be applied to old nuclear power plants but most be embodied in a new plant which also requires a lot of investment in cement and electronics. Net domestic investment is about 4% of GDP so if all of this is necessary to take advantage of innovation investment (2.7% of gdp), we should increase “required” to 6.7% of GDP which is equivalent to multiplying the above calculation by 0.4 (2/7/6.7). Doing so reduces the benefit to cost ratio to 5.3 which means we still get a very large internal rate of return of 27% per year.
Other factors raise the benefit to cost ratio. Health innovations, for example, don’t necessarily show up in GDP but are extremely valuable. Taking health innovation cost out of x means every other R&D investment must be having a bigger effect on GDP and so raises the ratio. Alternatively, including health innovations in benefits, a tricky calculation since longer life expectancy is valuable in itself and raises the value of GDP, increases the ratio even more. (See also Why are the Prices So Damn High? on this point). International spillovers also increase the value of US innovation spending.
Bottom line is, as Jones and Summers argue, “analyzing the average returns from a wide variety of perspectives suggests that the social returns [to innovation spending] are remarkably high.”
New measures for health care productivity
The most productive part of medical care is treatment for cardiovascular disease, both acute conditions and risk factors. Productivity estimates for acute cardiovascular diseases are $89,000 in aggregate — 79% of the total increase [in health care productivity from 1999 to 2012].
There has been very little progress over that same period in treating mental illness, arthritis, and musculoskeletal conditions. How about this:?
Despite a vast increase in the number of people treated with drugs for mental illness, the population’s mental health showed essentially no change over time.
Overall medical care was increasing in productivity over that period by about 0.7% a year, still great stagnation territory as they say.
That is all from a new paper by David M. Cutler, Kaushik Ghosh, Kassandra Messer, Trivellore Raghunathan, Allison B. Rosen, and Susan T. Stewart.
The Elite Quality Index
Here are the top ten, by Tomas Casas and Guido Cozzi:
1. Singapore
2. Switzerland
3. Germany
4. United Kingdom
5. United States
China comes in #12, Mexico wins for Latin America, Poland overperforms and France (!) underperforms. Botswana is #23, and Argentina…uh-oh. I don’t quite understand how the index is constructed, but how much a given elite focuses on Value Creation and avoids rent-seeking seems to be a key consideration. The degree of Regulatory Capture counts as a negative. Overall, the U.S. does very, very well on many metrics, but does poorly on Value Extraction.
Here is the underlying paper. Here is the sponsoring organization. Here is a lengthy treatment of the methodology. For the pointer I thank Chandran.