Category: Data Source
Response rates are falling
In 1997, the response rate to a typical telephone poll was a healthy 36 percent, according to Pew. By 2012, it had fallen to 9 percent. Fortunately, many surveys appear to be doing a good job of weighting the answers of people who do respond, to make up for those who don’t. Still, the long-term reasons for concern are clear: People who are more likely to avoid polls, such as anyone born after, say, 1980, are different from those who answer them.
The response rate of the Labor Department’s monthly jobs survey is far higher (about 89 percent) than that of a political poll, but it has also fallen (from 96 percent in the 1980s). Not surprisingly, the people who do not respond have different experiences in the job market than those who do.
That is from David Leonhardt. One implication is that actual unemployment may be higher than we are measuring.
Police Killings
Richard Epstein writes:
Police officer deaths in the line of duty, year to date for 2014, were 67 of which 27 were by gunfire. For the full year of 2013, the numbers were 105 total deaths, with 30 by gunfire. It would be odd to say that police officer deaths (which are more common than deaths to citizens from police officers) should not count…
It would indeed be odd to say that police officer deaths should not count, which is perhaps why no one says this. Police officer deaths are counted but the literal truth is that we don’t count deaths to citizens. No one knows for sure exactly how many citizens are killed by police because the government doesn’t keep a count. Draw your own conclusions. What we do know, is that it is not true that police officer deaths are more common than deaths to citizens from police officers. Not even close.
105 officers were killed in the line of duty in 2013 but to be clear this includes heart attacks, falls, and automobile accidents. Deaths due to violent conflict include 30 deaths by gunfire, 5 vehicular assaults, 2 stabbings and a bomb. To be conservative, let’s say 50 deaths to police at the hands of citizens.
According to the FBI there are around 400 justifiable homicides by police every year, where justified is defined as the killing of a felon by a law enforcement officer in the line of duty. But note that if the killing of Michael Brown is found to be unjustified it won’t show up in these statistics.
The best information we have of citizens killed by the police, believe it or not, are private tabulations from newspaper accounts. On the basis of one such collection, DataLab at FiveThirtyEight estimates that police kill 1000 people a year.
Thus, killings by police seem to be on the order of 10 to 20 times higher than killings of police.
Import Competition and the Great U.S. Employment Sag of the 2000s
In the new NBER paper on this topic by Daron Acemoglu, David Autor, David Dorn, Gordon H. Hanson, and Brendan Price, we see the evidence for this proposition piling up:
Even before the Great Recession, U.S. employment growth was unimpressive. Between 2000 and 2007, the economy gave back the considerable gains in employment rates it had achieved during the 1990s, with major contractions in manufacturing employment being a prime contributor to the slump. The U.S. employment “sag” of the 2000s is widely recognized but poorly understood. In this paper, we explore the contribution of the swift rise of import competition from China to sluggish U.S. employment growth. We find that the increase in U.S. imports from China, which accelerated after 2000, was a major force behind recent reductions in U.S. manufacturing employment and that, through input-output linkages and other general equilibrium effects, it appears to have significantly suppressed overall U.S. job growth. We apply industry-level and local labor market-level approaches to estimate the size of (a) employment losses in directly exposed manufacturing industries, (b) employment effects in indirectly exposed upstream and downstream industries inside and outside manufacturing, and (c) the net effects of conventional labor reallocation, which should raise employment in non-exposed sectors, and Keynesian multipliers, which should reduce employment in non-exposed sectors. Our central estimates suggest net job losses of 2.0 to 2.4 million stemming from the rise in import competition from China over the period 1999 to 2011. The estimated employment effects are larger in magnitude at the local labor market level, consistent with local general equilibrium effects that amplify the impact of import competition.
There are more details in this version of the paper than in an earlier version cited on this blog. Here is my related column on economic contraction, from a few days back.
China estimate of the day
Mr Gan estimates that China’s existing housing stock is already more than sufficient for every household to own their home but developers are still supplying well over 15m new units a year.
There is more here from Jamil Anderlini in the FT, more than just the usual.
“Average is Over” will come last to New Zealand
I sometimes say it is coming first to Israel and Singapore (and England?), but the Kiwis are a different case. Eric Crampton quotes from an NZ Ministry report:
Overall, there is no evidence of any sustained rise or fall in inequality in the last two decades. The level of household disposable income inequality in New Zealand is a little above the OECD median. The share of total income received by the top 1% of individuals is at the low end of the OECD rankings.
You also will note that New Zealand has been a steady under-performer in terms of economic growth, despite a lot of good policy decisions. This has helped keep income inequality down.
On this note, the paperback of Average is Over is coming out August 26th, you can order your copy here.
The loss of skill in the Industrial Revolution
From The Growth Economics Blog:
There’s a recent working paper by Alexandra de Pleijt and Jacob Weisdorf that looks at skill composition of the English workforce from 1550 through 1850. They do this by looking at the occupational titles recorded in English parish records over that period, and code each observed worker by the skill associated with their occupation. They use the standardized Dictionary of Occupational Titles to infer the skill level for any given occupation. For example, a wright is a high-skilled manual laborer, a tailor is medium-skilled, while a weaver is a low-skilled manual laborer.
The big upshot to their paper is that there was substantial de-skilling over this period, driven mainly by a shift in the composition of manual laborers. In 1550, only about 25% of all manual laborers are unskilled (think ditch-diggers), while 75% are either low- or medium-skilled (weavers or tailors). However, over time there is a distinct growth in the the unskilled as a fraction of manual laborers, reaching 45% by 1850, while the low- and medium-skilled fall to 55% in the same period. You can see in their figure 10 that this shift really starts to take place by 1650, while before the traditional start of the Industrial Revolution.
Looking at more refined measures, de Pleijt and Weisdorf find that the fraction of workers classified as “high-quality workmen” – carpenters, joiners, wrights, turners – rose only from 3.9% to 4.9% of the workforce between 1550 and 1850.
Adjustment to major technological shocks takes a long time…
Is Europe’s problem not enough government spending? (EU fact of the day)
Here is an update from Leonid Bershidsky:
Among the 28 EU members, public spending reached 49 percent of gross domestic product in 2013, 3.5 percentage points more than in 2007.
There is more detail at the link, via Garett Jones, Humanist by way of Walt Whitman, Civilizationist by way of Jane Jacobs.
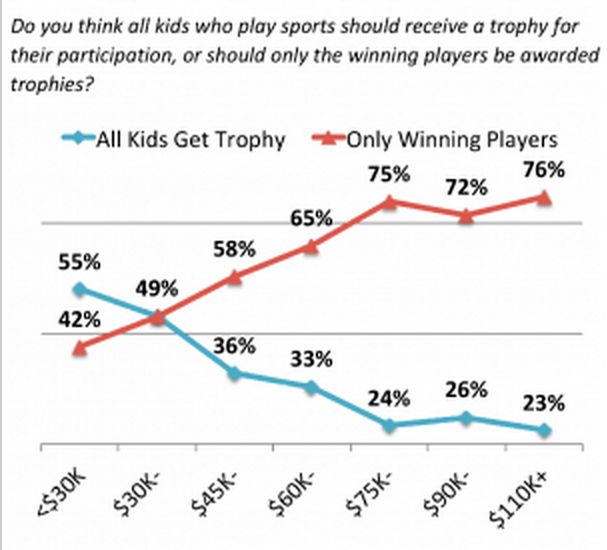
Should Only Winners Get Trophies?
A Reason-Rupee poll asked
Do you think all kids who play sports should receive a trophy for their participation, or should only the winning players be awarded trophies?
Overall, an estimated 57% Americans said that only the winning players should be awarded trophies but there were big differences according to gender, race, politics, education and income. 62% of men, for example, said that only the winning players should be awarded trophies compared to 52% of women. These results are consistent with experiments in which women tend to shy away from competition (perhaps with long-run consequences in the workforce). Whites opt for trophies to the winners-only at 63% compared to African Americans at just 44% and Hispanics at 39%. A whopping 80% of libertarians say that trophies should go only to the winners compared to conservatives at 63% and liberals and progressives both at 53%. More educated respondents were more likely to opt for trophies for only the winners. Trophies for the winners also increased strongly in income which could be because people with high income feel that they are winners or perhaps because people with high incomes are the types of people who enjoy competition.
Note that these are raw differences not betas from a statistical regression and since income, race, education etc. aren’t independent we don’t know which are the most controlling although the results point in directions consistent with other evidence. The data can be found here.
From the comments, on Bob Shiller and CAPE
For context, CAPE is the cyclically adjusted price-earnings ratio. On that topic, 3rdMoment writes:
While I have great respect for Shiller, I don’t understand his confidence that the CAPE is likely to return to it’s historical average of around 16. There are several reasons why we might expect the average CAPE going forward to be higher than in the past:
1. The average levels of CAPE in most of the last century appear, with hindsight, to have been puzzlingly low. This is the well-known “equity premium puzzle.”
2. There has been a large shift in corporate payout mix, from virtually all dividends in the past, to a roughly equal mix of dividends and share repurchases today. This by itself will add a couple of points to CAPE even if nothing else changes, (as shown in this post by the anonymous blogger who tweets as “Jesse Livermore”): http://www.philosophicaleconomics.com/2013/12/Shiller/
3. Some other accounting changes to the definition of profits might raise the CAPE as well, again see the linked blog post above.
4. Lower information and transaction costs and the rise of index investing have dramatically lowered the cost of maintaining a globally diversified portfolio. This decreases the raw rate of return for any given required rate of realized returns. For example if the costs of investing in equities fall by just 50 basis points, this would allow the required raw earnings yield to fall from 5% to 4.5%, corresponding to a rise in CAPE from 20 to 22, without changing realized returns for investors.
5. The real “risk free” return on treasuries seems to be very low by historic standards. Real returns on other forms of debt also appear low. This lowers the return stocks need to be attractive by comparison.
6. Large corporate cash balances, a “global savings glut,” lower rates of real economic growth, possible “secular stagnation,” all seem to point to the idea that real returns are somewhat harder to get than the past.
Some of these reasons are more certain than others, but taken together they seem to show that we have good reason to expect CAPE levels significantly above the historical average going forward.
Are there any countervailing reasons offsetting the list above, factors that would tend to make CAPE lower than in the past? I can’t really think of any. And I haven’t seen anybody else offering any.
Brad DeLong is relatively optimistic on stock returns
There are many interesting charts and graphs in the post, and he argues against a belief in mean reversion, along with a discussion of “the original Black Swan.” It is a difficult post to excerpt, best to read and view the whole thing.
Are big cities bad places to live?
Kevin Bryan directs my attention to this David Albouy paper (pdf), which attempts to estimate the quality of life across various metropolitan areas. Here is the key part of the abstract:
…adjusted quality-of-life measures successfully predict how housing costs rise with wage levels, are positively correlated with popular “livability” rankings and stated preferences, and do not decrease with city size. Mild seasons, sunshine, hills, and coastal proximity account for most inter-metropolitan quality-of-life differences.
If you go to Table A1, toward the very back of the paper, Honolulu is #1, followed by some fancy places in northern California, Santa Barbara, and Santa Fe. Last on the list are Decatur, Il, Beaumont-Port Arthur Texas, and last and also least is Kokomo, Indiana.
The states with the highest qualify of life are out west and in New England. I suspect these rankings are not taking heterogeneity seriously enough, as market prices capture marginal values but marginal values only for some movers. “Livability” is actually closer to an “average value” sort of concept. In other words, even with above average income I don’t want to have to pay Santa Barbara home prices.
In any case, the topic has come up lately and I thought I would pass these results along.
How should we quantify coolness? (from the comments)
David H. writes:
Yes, this Forbes list is a miserable failure, but it got me thinking about how to quantify coolness. Good restaurants are valuable, but to be cool, restaurants also need to be affordable and a little off-putting. If I were doing this, I would generate a list of touring bands that rank highly in RYM, knock out the superstars, and then see what US cities they played in the last 4 years. Each band-visit would count as a portion of coolness for that city, and a partial portion for the immediate vicinity. Also, RYM records which cities the bands came from. That should count for a lot. Then I would look for cities with an outsized and lively gay scene. I’m not sure how the causation works – whether a gay scene adds substantial coolness or whether it follows coolness – but the correlation seems pretty clear to me.
Coolness is unstable partly because it’s much more difficult to achieve in expensive cities. San Francisco and Berkeley are sinking in coolness partly for this reason. A truly cool city needs a critical mass of underemployed creative types who will devote a great deal of time to “the scene”, and this is hard to do when you’re paying $6+ for each of your beers. So, the lower the urban rents and general cost of living, the cooler the city, other things being equal.
OK, Forbes was right that proportion of young people living in the city is important. I also think that trends are important, like: Which cities are gaining young people, and which are losing them?
What else?
The link to RYM was added by me. I would think that a truly cool place cannot be rated as cool by too many other sources. How about that retirement community in Florida, an incorporated city, ruled largely by contract, where only the elderly live and the visits of grown children are regulated and rationed? How about the city in America which has the highest birth rate? Isn’t that kind of cool? Seriously. That would put Memphis, Ogden, and Provo in the lead. What’s so cool about tracking RYM?
Will the recent decline in entrepreneurship be reversed by demographic forces?
Annie Lowrey documents that decline, Matt Yglesias offers a partially optimistic hypothesis:
…people are founding fewer new businesses. But why?
One possibility is that the link to population aging is quite literal. A study by Vivek Wadhwa, Raj Aggarwal, Krisztina Holly, and Alex Salkever that looked specifically at “high-growth” industries found that the typical successful founder is 40. Not someone who’s at the tail-end of his career, but not someone who’s fresh out of school either. That’s in part because “professional networks were important to the success of their current business for 73 percent of the entrepreneur,” and it takes time to achieve that success. Mark Zuckerberg founded a great company when he was in college, but that kind of super-young founder is the exception not the rule — most people need some practical experience and contacts to succeed.
And back in the early 1990s, there were a lot of people in their late-thirties and early forties…
Nowadays that cohort of people’s prime founding years are behind them. There is another large cohort of people coming up, but right now they’re too young to be peak entrepreneurs. This cool CNN graphic shows that the most common age in the United States right now is 22 and 23, and that’s followed by 53 and 52.
The story about aging is so well-known that people tend to neglect this sub-trend of the youth bulge. But right now we’re at a moment where a lot of inexperienced workers are entering the labor market, and 10 to 20 years from now we’ll be in a moment when a lot of experienced workers are founding new businesses. But for the past 10 years, we’ve been seeing a demographic trend that’s unfavorable to entrepreneurship.
There are a few relevant questions:
1. At any point in time, are there external benefits or external costs to having more new businesses founded?
2. As organizational capabilities increase with progress, does market equilibrium serve up larger and older firms? It seems so.
3. What are the external social costs and benefits of that progression?
In poor, developing economies, I think of high levels of petty entrepreneurship as a negative, rather than a positive. Might the United States be a bit the same way? Yet the continuation of The Great Stagnation makes that a hard line to buy into enthusiastically.
I thank Robin Hanson for a useful conversation related to this blog post.
The economics of cyclone disasters
It’s not quite the Solow model. Here is a new paper from Solomon M. Hsiang and Amir S. Jin, “The Causal Effect of Environmental Catastrophe on Long-Run Economic Growth: Evidence From 6,700 Cyclones,” the abstract is this:
Does the environment have a causal effect on economic development? Using meteorological data, we reconstruct every country’s exposure to the universe of tropical cyclones during 1950-2008. We exploit random within-country year-to-year variation in cyclone strikes to identify the causal effect of environmental disasters on long-run growth. We compare each country’s growth rate to itself in the years immediately before and after exposure, accounting for the distribution of cyclones in preceding years. The data reject hypotheses that disasters stimulate growth or that short-run losses disappear following migrations or transfers of wealth. Instead, we find robust evidence that national incomes decline, relative to their pre-disaster trend, and do not recover within twenty years. Both rich and poor countries exhibit this response, with losses magnified in countries with less historical cyclone experience. Income losses arise from a small but persistent suppression of annual growth rates spread across the fifteen years following disaster, generating large and significant cumulative effects: a 90th percentile event reduces per capita incomes by 7.4% two decades later, effectively undoing 3.7 years of average development. The gradual nature of these losses render them inconspicuous to a casual observer, however simulations indicate that they have dramatic influence over the long-run development of countries that are endowed with regular or continuous exposure to disaster. Linking these results to projections of future cyclone activity, we estimate that under conservative discounting assumptions the present discounted cost of “business as usual” climate change is roughly $9.7 trillion larger than previously thought.
That link has an NBER gate, I do not yet see an ungated version.
Sentences about poverty
The number of distressed neighborhoods in the suburbs grew by nearly 140 percent, compared to 50 percent in urban areas.
That is since 2000, from Danielle Kurtzleben.