Category: Data Source
U.S. IT investment as a share of gdp
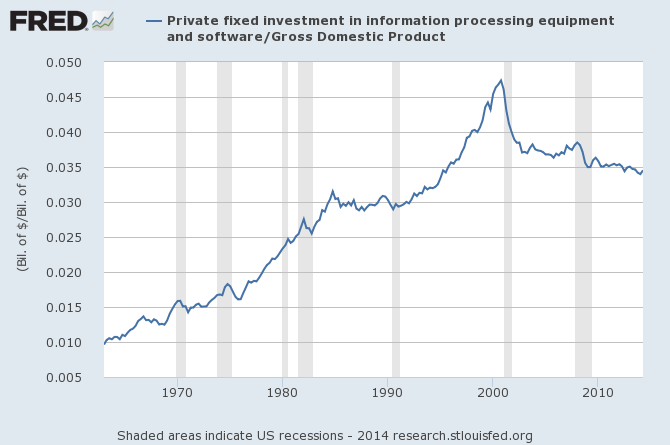
The pointer is from Matt Yglesias.
Addendum: Claudia Sahm refers us to this chart of declining IT prices. It also can be argued that IT spending moved into other, more general business categories.
American firms are aging too
The share of firms aged 16 years or more was 23 percent in 1992, but leaped to 34 percent by 2011—an increase of 50 percent in two decades. The share of private-sector workers employed in these mature firms increased from 60 percent to 72 percent during the same period. Perhaps most startling, we find that employment and firm shares declined for every other firm age group during this period.
We explore three potential contributing factors driving the increasing share of economic activity occurring in older firms, and find that a secular decline in entrepreneurship is playing a major role. We also believe that increasing early-stage firm failure rates might be a growing factor.
From Ian Hathaway and Robert E. Litan, there is more here.
Very good fragments of sentences
…trade typically favors the poor, who concentrate spending in more traded sectors.
That is from Pablo D. Fajgelbaum and Amit K. Khandelwal, the full paper is here.
We’re not as wealthy as we thought we were
The inflation-adjusted net worth for the typical household was $87,992 in 2003. Ten years later, it was only $56,335, or a 36 percent decline, according to a study financed by the Russell Sage Foundation. Those are the figures for a household at the median point in the wealth distribution — the level at which there are an equal number of households whose worth is higher and lower.
…“The housing bubble basically hid a trend of declining financial wealth at the median that began in 2001,” said Fabian T. Pfeffer, the University of Michigan professor who is lead author of the Russell Sage Foundation study.
From Anna Bernasek, there is more here. And background here.
What is the cheapest form of green power? (let’s ask Petr Beckmann)
From Free Exchange:
…levelised costs do not take account of the costs of intermittency…
Seven solar plants or four wind farms would thus be needed to produce the same amount of electricity over time as a similar-sized coal-fired plant. And all that extra solar and wind capacity is expensive.
If all the costs and benefits are totted up using Mr Frank’s calculation, solar power is by far the most expensive way of reducing carbon emissions. It costs $189,000 to replace 1MW per year of power from coal. Wind is the next most expensive. Hydropower provides a modest net benefit. But the most cost-effective zero-emission technology is nuclear power. The pattern is similar if 1MW of gas-fired capacity is displaced instead of coal. And all this assumes a carbon price of $50 a tonne. Using actual carbon prices (below $10 in Europe) makes solar and wind look even worse. The carbon price would have to rise to $185 a tonne before solar power shows a net benefit.
There is more here. The relevant cited studies you can find here.
America fact of the day
The manufacturing sector is now operating at 77.8 percent of its capacity, according to Federal Reserve data, well above the 76 percent average during the last expansion and not far from the 79.1 percent peak during the mid-2000s.
That is from Neil Irwin. As I’ve been saying for over a year, we are no longer at the point where boosting nominal demand will help very much if at all.
Which part of the world is in trouble?
Slowest Growing Populations (%, 2000-10)
1 Moldova -13%
2 Georgia -8%
3 #Ukraine-7%
4 Bulg -6%
5 Latvia -6%
6 Lithuania -5%
7 Belarus -5%
That is from here, the most rapidly growing populations are given here, some Gulf states and Africa, both are tweets from Ian Bremmer.
Overall large retailers are raising wages
There is a new NBER Working Paper from Brianna Cardiff-Hicks, Francine Lafontaine, and Kathryn Shaw, and the abstract is this:
With malls, franchise strips and big-box retailers increasingly dotting the landscape, there is concern that middle-class jobs in manufacturing in the U.S. are being replaced by minimum wage jobs in retail. Retail jobs have spread, while manufacturing jobs have shrunk in number. In this paper, we characterize the wages that have accompanied the growth in retail. We show that wage rates in the retail sector rise markedly with firm size and with establishment size. These increases are halved when we control for worker fixed effects, suggesting that there is sorting of better workers into larger firms. Also, higher ability workers get promoted to the position of manager, which is associated with higher pay. We conclude that the growth in modern retail, characterized by larger chains of larger establishments with more levels of hierarchy, is raising wage rates relative to traditional mom-and-pop retail stores.
This is not a surprising result, but it doesn’t receive nearly enough attention in popular discussions of the subject. There is a related ungated earlier draft here.
Global inequality is down all the more if we count lifespan
From Becker, Philipson, and Soares (pdf):
GDP per capita is usually used to proxy for the quality of life of individuals living in different countries. Welfare is also affected by quantity of life, however, as represented by longevity. This paper incorporates longevity into an overall assessment of the evolution of cross-country inequality and shows that it is quantitatively important. The absence of reduction in cross-country inequality up to the 1990s documented in previous work is in stark contrast to the reduction in inequality after incorporating gains in longevity. Throughout the post–World War II period, health contributed to reduce significantly welfare inequality across countries. This paper derives valuation formulas for infra-marginal changes in longevity and computes a “full” growth rate that incorporates the gains in health experienced by 96 countries for the period between 1960 and 2000. Incorporating longevity gains changes traditional results; countries starting with lower income tended to grow faster than countries starting with higher income. We estimate an average yearly growth in “full income” of 4.1 percent for the poorest 50 percent of countries in 1960, of which 1.7 percentage points are due to health, as opposed to a growth of 2.6 percent for the richest 50 percent of countries, of which only 0.4 percentage points are due to health. Additionally, we decompose changes in life expectancy into changes attributable to 13 broad groups of causes of death and three age groups. We show that mortality from infectious, respiratory, and digestive diseases, congenital, perinatal, and “ill-defined” conditions, mostly concentrated before age 20 and between ages 20 and 50, is responsible for most of the reduction in life expectancy inequality. At the same time, the recent effect of AIDS, together with reductions in mortality after age 50—due to nervous system, senses organs, heart and circulatory diseases—contributed to increase health inequality across countries.
That reminder is from Aaron Schwartz. And of course that is the Becker, yet another contribution from Gary Becker.
Do note, by the way, that medical progress is usually egalitarian per se. A common metric is something like “health outcomes of the poor” vs. “health outcomes of the rich,” and that may or may not be moving in an egalitarian direction. But very often the more incisive metric is “health outcomes of the sick” vs. “health outcomes of the healthy,” and of course most medical treatments are going to the sick. The more desperate is the lot of the sick, the more likely that medical progress is egalitarian per se.
For whom are the moochers actually voting?
It is a pretty mixed bag, as illustrated by this newly published paper by Dean Lacy, the abstract is here:
The 2012 election campaign popularized the notion that people who benefit from federal spending vote for Democrats, while people who pay the preponderance of taxes vote Republican. A survey conducted during the election included questions to test this hypothesis and to assess the accuracy of voters’ perceptions of federal spending. Voters’ perceptions of their benefit from federal spending are determined by family income, age, employment status, and number of children, as well as by party identification and race. Voters aged 65 and older who believe they are net beneficiaries of federal spending are more likely to be Democrats and vote for Barack Obama than seniors who believe they are net contributors to the federal government. However, the 77.5 percent of voters under age 65 who believe they are net beneficiaries of federal spending are as likely to vote for Romney as for Obama and as likely to be Republicans as Democrats. Voters who live in states that receive more in federal funds than they pay in federal taxes are less likely to vote for Obama or to be Democrats. For most of the electorate, dependence on federal spending is unrelated to vote choice.
Hat tip goes to Kevin Lewis. I am not able to find an ungated copy.
Kevin also points us to this interesting paper interpreting the Scandinavian model. The authors are Erling Barth, Karl O. Moene, and Fredrik Willumsen, and the abstract is this:
The small open economies in Scandinavia have for long periods had high work effort, small wage differentials, high productivity, and a generous welfare state. To understand how this might be an economic and political equilibrium we combine models of collective wage bargaining, creative job destruction, and welfare spending. The two-tier system of wage bargaining provides microeconomic efficiency and wage compression. Combined with a vintage approach to the process of creative destruction we show how wage compression fuels investments, enhances average productivity and increases the mean wage by allocating more of the work force to the most modern activities. Finally, we show how the political support of welfare spending is fueled by both a higher mean wage and a lower wage dispersion.
Again, I cannot find an ungated copy.
The Prison Boom and the Lack of Black Progress
There is a new and extremely distressing NBER paper by Derek Neal and Armin Rick:
More than two decades ago, Smith and Welch (1989) used the 1940 through 1980 census files to document important relative black progress. However, recent data indicate that this progress did not continue, at least among men. The growth of incarceration rates among black men in recent decades combined with the sharp drop in black employment rates during the Great Recession have left most black men in a position relative to white men that is really no better than the position they occupied only a few years after the Civil Rights Act of 1965. A move toward more punitive treatment of arrested offenders drove prison growth in recent decades, and this trend is evident among arrested offenders in every major crime category. Changes in the severity of corrections policies have had a much larger impact on black communities than white communities because arrest rates have historically been much greater for blacks than whites.
Decriminalizing indoor prostitution
There is a new NBER paper by Scott Cunningham and Manisha Shah:
Most governments in the world including the United States prohibit prostitution. Given these types of laws rarely change and are fairly uniform across regions, our knowledge about the impact of decriminalizing sex work is largely conjectural. We exploit the fact that a Rhode Island District Court judge unexpectedly decriminalized indoor prostitution in 2003 to provide the first causal estimates of the impact of decriminalization on the composition of the sex market, rape offenses, and sexually transmitted infection outcomes. Not surprisingly, we find that decriminalization increased the size of the indoor market. However, we also find that decriminalization caused both forcible rape offenses and gonorrhea incidence to decline for the overall population. Our synthetic control model finds 824 fewer reported rape offenses (31 percent decrease) and 1,035 fewer cases of female gonorrhea (39 percent decrease) from 2004 to 2009.
Alas, I do not see ungated versions on Google, or maybe try this one (pdf).
Roman communication costs in time and expense
The Stanford Geospatial Network Model of the Roman World
“For the first time, ORBIS allows us to express Roman communication costs in terms of both time and expense. By simulating movement along the principal routes of the Roman road network, the main navigable rivers, and hundreds of sea routes in the Mediterranean, Black Sea and coastal Atlantic, this interactive model reconstructs the duration and financial cost of travel in antiquity.”
For the pointer I thank Michael Gibson.
How has the restaurant experience changed in the last ten years?
This is from a New York Craigslist post, from a restaurant owner who apparently viewed tapes of customers from 2004 and 2014, here is part of his account of the more recent behavior:
2014
Customers walk in.
Customers get seated and is given menus, out of 45 customers 18 requested to be seated elsewhere.
Before even opening the menu they take their phones out, some are taking photos while others are simply doing something else on their phone (sorry we have no clue what they are doing and do not monitor customer WIFI activity).
7 out of the 45 customers had waiters come over right away, they showed them something on their phone and spent an average of 5 minutes of the waiter’s time. Given this is recent footage, we asked the waiters about this and they explained those customers had a problem connecting to the WIFI and demanded the waiters try to help them.
Finally the waiters are walking over to the table to see what the customers would like to order. The majority have not even opened the menu and ask the waiter to wait a bit.
Customer opens the menu, places their hands holding their phones on top of it and continue doing whatever on their phone.
There is more here, interesting throughout, and for the pointer I thank Jacqueline Mason.
Using Big Data to find employees who will not leave
This is for call center operators:
The results are surprising. Some are quirky: employees who are members of one or two social networks were found to stay in their job for longer than those who belonged to four or more social networks (Xerox recruitment drives at gaming conventions were subsequently cancelled). Some findings, however, were much more fundamental: prior work experience in a similar role was not found to be a predictor of success.
“It actually opens up doors for people who would never have gotten to interview based on their CV,” says Ms Morse. Some managers initially questioned why new recruits were appearing without any prior relevant experience. As time went on, attrition rates in some call centres fell by 20 per cent and managers no longer quibbled. “I don’t know why this works,” admits Ms Morse, “I just know it works.”
The rest of the Tim Smedley FT story is here, via Peter Sahui.