Category: Data Source
Are We Adapting to Climate Change?
Not so much, at least not yet:
We study whether the sensitivity of economic, health, and livelihood outcomes to climate extremes has declined over the last half century, consistent with adaptation. Understanding whether such adaptation is already occurring is central to anticipating future climate damages, to calibrating the level of ambition needed for emissions mitigation efforts, and to understanding additional investments in adaptation that could be required to avoid additional damages. Using comprehensive panel data across diverse geographies and outcomes, including data on mortality, agricultural productivity, crime, conflict, economic output, and damages from flooding and tropical cyclones, we find limited systematic evidence of adaptation to date. Across 21 outcomes we study, six show a statistically significant declining sensitivity to a changing climate, five show an increasing sensitivity, and the remainder show no statistically significant change. Our results do not imply that specific documented adaptation efforts are ineffective or certain locations have not adapted, but instead that the net effects of existing actions have largely not been successful in meaningfully reducing climate impacts in aggregate. To avoid ongoing and future damages from warming, our results suggest a need to identify promising adaptation strategies and understand how they can be scaled.
That is from a new NBER working paper by Marshall Burke, et.al.
Behavioral attenuation
We report a large-scale examination of behavioral attenuation: due to information-processing constraints, the elasticity of people’s decisions with respect to economic fundamentals is generally too small. We implement more than 30 experiments, 20 of which were crowd-sourced from leading experts. These experiments cover a broad range of economic decisions, from choice and valuation to belief formation, from strategic games to generic optimization problems, involving investment, savings, effort supply, product demand, taxes, environmental externalities, fairness, cooperation, beauty contests, information disclosure, search, policy evaluation, memory, forecasting and inference. In 93% of our experiments, the elasticity of decisions to fundamentals decreases in participants’ cognitive uncertainty, our measure of the severity of information-processing constraints. Moreover, in decision problems with objective solutions, we observe elasticities that are universally smaller than is optimal. Many widely-studied decision anomalies represent special cases of behavioral attenuation. We discuss both its limits and why it often gives rise to the classic phenomenon of diminishing sensitivity.
That is from a new and very important working paper by Benjamin Enke, Thomas Graeber, Ryan Oprea, and Jeffrey Yang.
It could be said that incentives matter, but they do not matter enough. This is likely one of the most important economics papers of the year.
USA religion fact of the day
For the first time in modern American history, young men are now more religious than their female peers. They attend services more often and are more likely to identify as religious.
“We’ve never seen it before,” Ryan Burge, an associate professor of political science at Eastern Illinois University, said of the flip.
Among Generation Z Christians, this dynamic is playing out in a stark way: The men are staying in church, while the women are leaving at a remarkable clip.
Church membership has been dropping in the United States for years. But within Gen Z, almost 40 percent of women now describe themselves as religiously unaffiliated, compared with 34 percent of men, according to a survey last year of more than 5,000 Americans by the Survey Center on American Life at the American Enterprise Institute.
Here is the full story (NYT).
The Rapid Adoption of Generative AI
This paper reports results from the first nationally representative U.S. survey of generative AI adoption at work and at home. In August 2024, 39 percent of the U.S. population age 18-64 used generative AI. More than 24 percent of workers used it at least once in the week prior to being surveyed, and nearly one in nine used it every workday. Historical data on usage and mass-market product launches suggest that U.S. adoption of generative AI has been faster than adoption of the personal computer and the internet. Generative AI is a general purpose technology, in the sense that it is used in a wide range of occupations and job tasks at work and at home.
That is from a new paper by Alexander Bick, Adam Blandin, and David J. Deming, ungated copy here, blog post about it here.
Sweden fact of the day
However, following the start of PhD studies, the use of psychiatric medication among PhD students increases substantially. This upward trend continues throughout the course of PhD studies, with estimates showing a 40 percent increase by the fifth year compared to pre-PhD levels. After the fifth year, which represents the average duration of PhD studies in our sample, we observe a notable decrease in the utilization of psychiatric medication.
Here is the article, via Jesse. Here are some relevant tweets. It doesn’t have to be causal to be interesting!
The Economic Consequences of the French Wealth Tax
By Eric Pichet, here is the abstract:
Despite attempts to ‘unwind’ the Impôt de Solidarité sur la Fortune (‘Solidarity Wealth Tax,’ the French wealth tax) during the last legislature (2002-2007), ISF yields had soared by 2006, jumping from €2.5 billion in 2002 to €3.6 billion. Analysis of the economic consequences of this ISF wealth tax has raised the following conclusions: Tax collection costs remain low (around 1.6% of proceeds); Not raising the threshold in line with inflation between 1998 and 2004 created windfall revenues for the French State of €400 million in FY 2004 alone; ISF fraud mainly involving an under-assessment of property assets has stabilised over time at around 28% of total revenues, equivalent; (had the legal framework remained unchanged) to a shortfall for the State of €700 million in 2004; Capital flight since the ISF wealth tax’s creation in 1988 amounts to ca. €200 billion; The ISF causes an annual fiscal shortfall of €7 billion, or about twice what it yields; The ISF wealth tax has probably reduced GDP growth by 0.2% per annum, or around 3.5 billion (roughly the same as it yields); In an open world, the ISF wealth tax impoverishes France, shifting the tax burden from wealthy taxpayers leaving the country onto other taxpayers.
Via Fredrik. I would describe this work as a very loose estimate, nonetheless pointing in the proper direction.
State capacity and economic development
I do not in general trust such methods, but the conclusions are not unwelcome to me:
I provide new empirical estimates of the effect of state capacity on economic development across countries over the period 1960–2022. Specifically, I construct a comprehensive state capacity index based on six different dimensions of effective state institutions available in the Varieties of Democracy (V-Dem) dataset. Then, I estimate heterogeneous parameter models under a common factor framework. My empirical strategy explicitly allows the growth effect of state capacity to differ across countries and accounts for unobserved common factors. My preferred estimates indicate that a one-standard-deviation increase in my V-Dem-based state capacity index predicts a rise in income per person by roughly 6%–7%. The magnitude of such impact equates to less than half of that implied by conventional estimates obtained under highly restrictive assumptions of slope homogeneity and cross-sectional independence. Furthermore, I provide partial evidence suggesting that worldwide heterogeneity in the economic importance of state capacity is deeply rooted in prehistorically determined population diversity, state history, long-term relatedness between countries, and interpersonal trust.
That is from a new paper by Trung V. Vu, via the excellent Kevin Lewis. I am never sure if such results show anything more than “most good things come together at the macro level.”
Are “anchor babies” underrated?
Did you worry about the 2020 fall in U.S. fertility? Well, ponder this:
Birth rates in Canada and the USA declined sharply in March 2020 and deviated from historical trends. This decline was absent in similarly developed European countries. We argue that the selective decline was driven by incoming individuals, who would have travelled from abroad and given birth in Canada and the USA, had there been no travel restrictions during the COVID-19 pandemic. Furthermore, by leveraging data from periods before and during the COVID-19 travel restrictions, we quantified the extent of births by incoming individuals. In an interrupted time series analysis, the expected number of such births in Canada was 970 per month (95% CI: 710-1,200), which is 3.2% of all births in the country. The corresponding estimate for the USA was 6,700 per month (95% CI: 3,400-10,000), which is 2.2% of all births. A secondary difference-in-differences analysis gave similar estimates at 2.8% and 3.4% for Canada and the USA, respectively. Our study reveals the extent of births by recent international arrivals, which hitherto has been unknown and infeasible to study.
That is from a new paper by Amit N. Sawant and Mats J. Stensrud, via the excellent Kevin Lewis.
USA fact of the day
Surprised to learn that the US is below the OECD average for out of pocket health care spending as a fraction of per capita consumption, with virtually the same % as Canada.
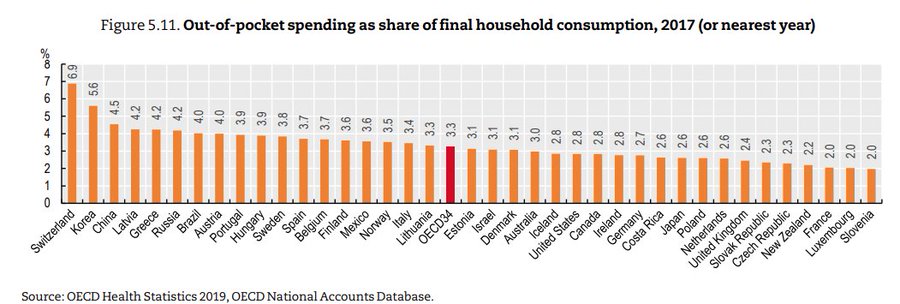
That is Jason Abaluck, via the wisdom of Garett Jones.
“four percent of humanity subscribes to OnlyFans” (from my email)
Andrew Cedotal writes me:
This issue came up with the post where someone claimed that N% of Americans were active OnlyFans content creators, here it is again!
For software services, total accounts ever created is a vanity metric. It’s not used by serious operators or investors of consumer-tech companies (the fact that it shows up in public financial reports so often thus has interesting implications).
The social impact/business value of a software service is about flow (e.g. monthly active users and monthly revenue), not stock. 100 real human signups means many, many fewer actual monthly active users (MAU) at any point, because users churn out. Even the best-retaining services around (e.g. Snap) only have 90% yearly retention, which then compounds downward.
Then there’s the issue that for any public software service, many accounts are bots, throwaways, people who forgot their password, etc.
Rather than make a truly wild guesstimate, let’s look at a frontier based on the report of $6.6B gross payments made by users in 2023 (so average revenue / month is $0.55B). All of the following are possible points on the frontier of paying MAU (paying monthly active users) vs. monthtly APPPU (monthly payments per paying user):
* 10 million paying MAU, $55 monthly APPPU
* 30 million paying MAU, $18.33 monthly APPPU
* 50 million paying MAU, $11 monthly APPPU
* 100 million paying MAU, $5.5 monthly APPPU(Industry standard is to look at ARPPU–average revenue per paying user–and not average payments, but I think here we’re more interested in determining how much money users are putting into it and ignoring platform take rate, not a financial analysis of the company.)
Now, OnlyFans might have ~300M total signups ever, but let’s assume half of those are dupes and bots. So 150M real human signups. It’s unlikely that more than 20% of people who have ever created an account have ever entered a credit card, so that’s 300 * 0.5 * .2 = 30M as a cap on people who have ever paid. Take into account userbase churn, and a guess is ~12M monthly paying accounts right now (0.15% of humanity, not 4%), which would put them at $45.83 monthly APPPU or a yearly APPPU of ~$550. About the annual cost of a gym membership in the U.S.
Which U.S. Stocks Generated the Highest Long-Term Returns?
This report describes compound return outcomes for the 29,078 publicly-listed common stocks contained in the CRSP database from December 1925 to December 2023. The majority (51.6%) of these stocks had negative cumulative returns. However, the investment performance of some stocks was remarkable. Seventeen stocks delivered cumulative returns greater than five million percent (or $50,000 per dollar initially invested), with the highest cumulative return of 265 million percent (or $2.65 million per dollar initially invested) accruing to long-term investors in Altria Group. Annualized compound returns to these top performers relatively were modest, averaging 13.47% across the top seventeen stocks, thereby affirming the importance of “time in the market.” The highest annualized compound return for any stock with at least 20 years of return data was 33.38%, earned by Nvidia shareholders.
Mental health trajectories in the UK
Yes, there is a human capital crisis of sorts:
We show the incidence of mental ill-health has been rising especially among the young in the years and especially so in Scotland. The incidence of mental ill-health among young men in particular, started rising in 2008 with the onset of the Great Recession and for young women around 2012. The age profile of mental ill-health shifts to the left, over time, such that the peak of depression shifts from mid-life, when people are in their late 40s and early 50s, around the time of the Great Recession, to one’s early to mid-20s in 2023. These trends are much more pronounced if one drops the large number of proxy respondents in the UK Labour Force Surveys, indicating fellow family members understate the poor mental health of respondents, especially if those respondents are young. We report consistent evidence from the Scottish Health Surveys and UK samples from Eurobarometer surveys. Our findings are consistent with those for the United States and suggest that, although smartphone technologies may be closely correlated with a decline in young people’s mental health, increases in mental ill-health in the UK from the late 1990s suggest other factors must also be at play.
That is from a new NBER working paper by David G. Blanchflower, Alex Bryson, and David N.F. Bell. By the way, on the “smart phone causality” issue, here are some recent musings. And a response, and a response to that.
Note that in my rough, first-order human capital hypothesis, the variance is rising. So the top achievers are considerably more impressive, but that also means the number of problematic cases, toward the bottom of the distribution, is rising as well.
Ireland fact of the day
Ireland ranks as the loneliest country in Europe, with almost a fifth of people lonely most or all of the time and nearly two-thirds of people suffer from anxiety or depression, according to EU data. One in seven children live in homes below the poverty line, defined as 60 per cent of the median disposable household income.
Here is more from the FT, with much of the piece about how Ireland should spend its budget surplus.
Jon Haidt on causality (from my email)
“Hi Tyler,
i have big news about the debate over social media harming teens.
So much of it hangs on the claim that the evidence is just correlational, not causal.
Zach Rausch and I show that this is not true; the experiments DO show causation, very clearly and consistently.
Here are my 2 tweets about the post:
https://x.com/JonHaidt/status/1829163166066205168
https://x.com/JonHaidt/status/1829165292460859869
A lot of people heard our discussion, and enjoyed how spirited and yet civil it was.
Might you include the link to this post in your daily email:
https://www.afterbabel.com/p/the-case-for-causality-part-1
We have 3 more coming. We think we can prove causality using just the existing experiments.
thanks for considering it.
jon”
TC again: I received this email this morning, and told Jon I would post it on MR without response from me, so here it is.
Failing Banks
From Sergio Correia, Stephan Luck, and Emil Verner:
Why do banks fail? We create a panel covering most commercial banks from 1865 through 2023 to study the history of failing banks in the United States. Failing banks are characterized by rising asset losses, deteriorating solvency, and an increasing reliance on expensive non-core funding. Commonalities across failing banks imply that failures are highly predictable using simple accounting metrics from publicly available financial statements. Predictability is high even in the absence of deposit insurance, when depositor runs were common. Bank-level fundamentals also forecast aggregate waves of bank failures during systemic banking crises. Altogether, our evidence suggests that the ultimate cause of bank failures and banking crises is almost always and everywhere a deterioration of bank fundamentals. Bank runs can be rejected as a plausible cause of failure for most failures in the history of the U.S. and are most commonly a consequence of imminent failure. Depositors tend to be slow to react to an increased risk of bank failure, even in the absence of deposit insurance.
Theory of bank runs: overrated.