A matching framework with neither evidence nor theory on its side
Imagine if the relevant “change variable,” in macro terms, was the ease and quality of matching.
In some mini-eras, matching does not work very well. The labor market is slow, real interest rates are low, and capital is very cheap. It is thus relatively easy for super-talented people — who often become quite wealthy — to commandeer resources for their grand projects. They can raise the money and they can raise the labor. We elevate the powers of those individuals.
The software infrastructure is built out, and solar power gets put on its way for a grander future. The progress foundations for the next generation or two are laid. At the same time, everyone complains that returns to savings are low, wages are sluggish, labor force participation is low, and so on.
In other mini-eras, matching works very well. The labor market is tight, and capital is hard to raise. So many of these resources already are allocated to where they ought to be, and not much is sitting around “slack.” Due to resource tightness and higher real interest rates, many projects end up abandoned. Yet the demand for labor is high and real wages are rising. Income inequality falls.
Sometimes these periods feel “especially boom-y,” because the concrete innovative fruits of the “poor matching era” finally are coming available. But truly new grand projects have a much harder time of it.
Perhaps one should behave and invest very differently, depending which kind of era it is? And are talent-spotting skills worth more in the poor matching era than in the well-matched era? Are there some sectors that always have a lot of slack resources? Music, intellectuals, the visual arts, NBA basketball, others? And in those cases talent-spotting skills remain valuable across the eras?
Yet none of this is true! The ease and quality of matching is not a relevant macroeconomic “hinge variable.”
p.s. Is it better that sometimes we have these periods of slack, so that the builders may do their thing!?
Attitudes toward capitalism (Poland fact of the day)
The author commissioned a survey on the image of capitalism in 34 countries. In only six of these countries – led by Poland and the United States – do pro-capitalist attitudes dominate. Although approval of capitalism increases when the word ‘capitalism’ is omitted (and instead only described), even then a positive attitude dominates in only seven of 34 countries. The most frequently mentioned criticisms of capitalism are that capitalism is dominated by the rich and that capitalism leads to growing inequality. Respondents with higher incomes and higher levels of education, men, and those who classified themselves as being on the right of the political spectrum are less anti-capitalist or are more pro-capitalist than the population at large in most countries. In 33 countries, anti-capitalists tend to be more conspiracy-minded than pro-capitalists.
That is from a new paper by Rainer Zitelman. And here is Rainer’s recent book In Defense Of Capitalism: Debunking the Myths.
Saturday assorted links
1. Interesting Toby Ord paper on the Lindy Effect.
2. Interview with Andras Schiff. Does he count as a grump?
3. Why didn’t we get a malaria vaccine sooner? Very good piece.
4. Graduate student GRE scores, by field.
5. Further detail on the recent climate change/research/publication bias/skewed results brouhaha. Useful addenda, the real story is somewhat more complicated than it has been presented?
Ames, Iowa, underrated mecca of science
Ames is only the 9th largest city in Iowa, and yet:
1. The city (and university) has supported three Nobel Laureates in economics, namely Schultz, Hurwicz, and Stigler.
2. The plutonium for the first atomic bomb was synthesized there.
3. The first electronic digital computer was built there.
4. George Washington Carver worked and taught there.
5. Neal Stephenson is from there.
6. Russ Roberts spent 1957 there.
7. The library of Iowa State University has some large (and very good) pro-science murals by American regionalist painter Grant Wood.
Hail Ames, Iowa!
How Mexico built a state (that was then, this is now)
Mexico in the nineteenth century presents a dramatic example of this problem. Mexico suffered extreme political instability and strife in the nineteenth century. There were 800 revolts between 1821 and 1875. Between independence in 1821 and 1900, Mexico had 72 different chief executives, meaning that the average term was only a little more than one year long. Likewise, the country had 112 finance ministers between 1830 and 1863. In addition there were several invasions and secessionist movements.
The country also experimented with several different forms of government, including two empires (one headed by a French-backed, Austrian-born member of the Habsburg dynasty), one disputed period where there were presidents from both main parties, four republics, one provisional republic, and a long dictatorship. President Guadalupe Victoria was the first constitutionally elected president of the country, and the only one who would complete a full term in the first 30 years of independence.
Some other examples: There were four Mexican presidents in the years 1829, 1839, 1846, 1847, and 1853, while there were five in 1844 and 1855 and eight in 1833. Antonio López de Santa Anna, who was President of Mexico on ten separate occasions, was president four different times in a single year.
Mexico faced constant challenges to its sovereignty in the first 50 years of independence, from the secessions of Texas and Central America, to the secession attempts of the Yucatán, as well as numerous smaller rebellions.
Here is more from the excellent Robin Grier, from Works in Progress. There are further points of interest in the piece.
Tokyo hotel bleg
Part of the time we will be in Roppongi, which is another good/different complementary part of town to stay in? And do you have particular hotel recommendations? This will be my fourth Tokyo trip, if that gives you further context.
Friday assorted links
1. Jon Elster on Marx and Freud.
2. Are right-wing boycotts working?
3. UFO information is not classified in Brazil.
4. Alex Ross on Franz Liszt (New Yorker).
5. New issue of Works in Progress, haven’t read it yet, looks great.
6. Rachel Kleinfeld on political polarization. One implication is that if you are making the other side feel more threatened, you are part of the problem.
The Real Secret of Blue Zones
Netflix has a new documentary on Blue Zones, regions in the world such as Okinawa Prefecture, Japan; Nuoro Province, Sardinia, Italy; the Nicoya Peninsula, Costa Rica; Icaria, Greece; and Loma Linda, California, where people appear to live “extraordinarily long and vibrant lives.” What are the secrets of such blue zones and how can you live to be 100?
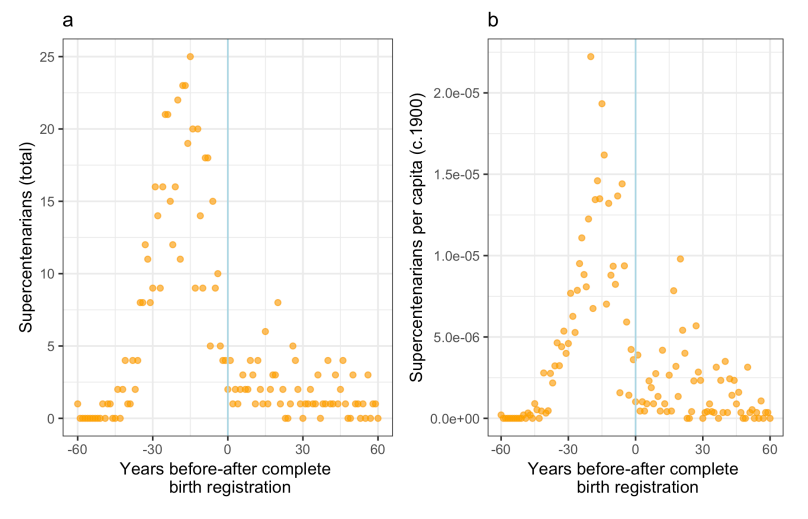
These blue zones first started to be discussed in the 2000s which means that people aged 100 or older were born sometime around 1900. What do we know about that period of history? It was before vital records were uniformly established. And what happens when state-wide certification goes into effect? Saul Justin Newman shows that the number of supercentarians [100+] drops sharply a hundred or so years later!
…the introduction of state-wide birth certification coincides with a sharp reduction in the number of supercentenarians born in each state. In total, 82% of the GRG supercentenarian records from the USA predate state-wide birth certification. Forty-two states achieved complete birth certificate coverage during the survey period. When these states transition to state-wide birth registration, the number of supercentenarians falls by 80% per year overall and 69% per capita when adjusted relative to c.1900 state population sizes.
The author goes on to show that in many countries the number of of extremely old people is positively correlated with poverty, shorter average life spans and illiteracy. All factors which are difficult to explain if we think these factors are causally related to health but which make sense if we think that the explanation is unreliable birth and death records. Supercentenarian birthdates also exhibit patterns such as age-heaping that are “strongly indicative of manufactured birth data.”
In addition, cross-country comparisons don’t make much sense if we focus on health:
In 1900 the UK had eight million more inhabitants than Italy, a 1.22-fold larger population. Citizens of the UK also enjoyed 2.5 times the GDP per capita, earned 3.5 times higher wages in real terms, had 1.25 times lower income inequality, received 2.2 times the average education (with just 5.3 years of schooling), were four times less likely to be murdered, were 3.8cm taller, and lived 5.3 years longer on average than people in Italy. Given these indicators and the long history of birth records in both countries, it is difficult to reconcile why the healthier, wealthier, better-educated, taller, and longer-lived population of the UK produced roughly a quarter as many SSCs per capita. One explanation is that remarkable age records result, not from better health or greater longevity, but from the historical accumulation of illiteracy-driven errors and the modern dynamics of poverty-driven fraud.
Thus, in Blue Zones, people aren’t necessarily living longer lives; they’re just experiencing a ‘senior moment’ with their date of birth.
Hat tip: The always skeptical, Paul Kedrosky.
Northern Virginia (Singapore) fact of the day
The data center cluster in Northern Virginia is three times the size of the next-largest data center area in the world, in Singapore. The industry saw a major boost during the pandemic, as more work and social life shifted online. Those boom times are expected to continue, with new artificial intelligence technology driving even more demand for server space. That’s significant for local governments increasingly dependent on the industry for tax revenue.
…Northern Virginia’s data centers had a 2% vacancy rate in the first half of 2023, and prices for companies looking to lease that space jumped by 15-20%, both signs of remarkably high demand for square footage in the massive complexes.
Here is the full story.
The Fast, the Slow, and the Congested
That is a new NBER working paper by Protty A. Akbar, Victor Couture, Gilles Duranton, and Adam Storeygard. Here is the abstract:
We assemble a new global database on motor vehicle travel speed in over 1,200 large cities in 152 countries. We then estimate comparable city-level indices of travel speed and congestion. Most of the variation in urban travel speed is across countries, not within. National income per capita explains most of this cross-country variation in speed. In rich countries, urban travel is roughly 50% faster than in poor countries. To investigate the link between economic development and mobility, we develop an urban model with endogenous travel, road infrastructure, and land area. The model provides an exact decomposition of how city size, infrastructure, and topography contribute to explaining why urban travel is faster in richer countries. We find that richer countries are faster, mainly because their cities have more major roads and wider land areas. These effects operate by increasing uncongested speed, not by reducing congestion.
In general, I am much more skeptical about slower modes of transportation than are many other MR readers, most of all those on the Left.
If you look on p.36, “major road length” is the variable most predictive of speed if you ask why rich countries are faster than are poor countries — please do not forget the Lucas Critique however! After all, they do measure Flint, Michigan as the fastest city [sic] in the world.
Here is a good paragraph (p.37):
Compared to other cities in the oecd, us cities are (exp(−0.27) − 1 =) 24% less populous, cover 72% more area, have 67% more major roads, and have 30% more roads that conform to the road network’s main grid orientation. Panel A of figure 5 reports the corresponding decomposition result. The low density of us cities explains most of why they are faster. Major roads matter too, as do griddier road networks. City size variables account for 47% of the speed difference between the us and other oecd countries, infrastructure accounts for 35%, and the share accounted for by topography is negligible.
If you are wondering, by their measures Dhaka is the slowest city in the world.
An excellent paper, recommended.
The impacts of Covid-19 absences on workers
In the Journal of Public Economics, by Gopi Shah Goda and Evan J. Soltas:
We show that Covid-19 illnesses and related work absences persistently reduce labor supply. Using an event study, we estimate that workers with week-long Covid-19 absences are 7 percentage points less likely to be in the labor force one year later compared to otherwise-similar workers who do not miss a week of work for health reasons. Our estimates suggest Covid-19 absences have reduced the U.S. labor force by approximately 500,000 people (0.2 percent of adults) and imply an average labor supply loss per Covid-19 absence equivalent to $9,000 in forgone earnings, about 90 percent of which reflects losses beyond the initial absence week.
Here is the full article.
Claims about Italy, Tiebout edition
Using census data, we study false birth-date registrations in Italy, a phenomenon well known to demographers, in a setting that allows us to separate honesty from the benefits of cheating and deterrence. By comparing migrants leaving a locality with those who remain in it, we illustrate the tendency of Italians to sort themselves across geographic areas according to their honesty levels. Over time, this tendency has modified the average honesty level in each locality, with relevant consequences for the distribution across geographic areas of outcomes like human capital, productivity, earnings growth, and the quality of local politicians and government.
That is from a new paper by Massimo Anelli, Tommaso Colussi, and Andrea Ichino, via the excellent Kevin Lewis. How many people recall that Tiebout’s initial work was drawn from New Jersey data?
What should I ask Rebecca F. Kuang?
I am a big fan of her latest book Yellowface, which I read straight through (and it’s much more double-edged and subversive than you might be expecting). Here is a partial bio:
Rebecca F. Kuang is the award-winning, #1 New York Times bestselling author of the Poppy War trilogy and Babel: An Arcane History, as well as the forthcoming Yellowface. [TC: no longer forthcoming] She has an MPhil in Chinese Studies from Cambridge and an MSc in Contemporary Chinese Studies from Oxford; she is now pursuing a PhD in East Asian Languages and Literatures at Yale.
Here is her Twitter. Here is her full of facts, but somehow a bit convoluted Wikipedia page. So what should I ask her?
Law-Abiding Immigrants
The subtitle is The Incarceration Gap Between Immigrants and the U.S.-Born, 1850–2020, and the authors are Ran Abramitzky, Leah Boustan, Elisa Jácome, Santiago Pérez, and Juan David Torres. Here is the to-the-point abstract:
Combining full-count Census data with Census/ACS samples, the researchers provide the first nationally representative long-run series (1870–2020) of incarceration rates for immigrants and the U.S.-born. As a group, immigrants had lower incarceration rates than the US-born for the last 150 years. Moreover, relative to the U.S.-born, immigrants’ incarceration rates have declined since 1960: Immigrants today are 60% less likely to be incarcerated (30% relative to U.S.-born whites). This relative decline occurred among immigrants from all regions and cannot be explained by changes in immigrants’ observable characteristics or immigration policy. Instead, the decline likely reflects immigrants’ resilience to economic shocks.
Here is the full paper, via Anecdotal.
Why do immigrants oppose immigration?
This question does not receive enough discussion, but there is a new paper of note, by Aflatun Kaeser and Massimiliano Tani:
…successful immigrants in the United States (i.e., those who are in the top quintile of the socioeconomic classification), who may benefit the most from being perceived as unrelated to unskilled undocumented immigrants, have negative views about immigration, especially with respect to its contribution to unemployment, crime, and the risk of a terrorist attack. This effect does not arise in the case of countries that apply stricter controls than the United States on immigration, like Australia, Canada, and New Zealand, or do not attract as large a number of undocumented immigrants. We interpret these results as evidence that immigrants’ attitudes toward other immigrants respond to the lack of a selective immigration policy: namely, if successful immigrants run the risk of being perceived as related to undocumented or uncontrolled immigration, they respond by embracing an immigrants’ anti-immigration view.
Via the excellent Kevin Lewis.