Chernobyl
 Chernobyl, HBO’s taut 5-part mini-series, is excellent and it sticks close to the facts (although one female character played by Emily Watson is clearly made up). By all accounts, the series accurately represents life in the former Soviet Union and through a variety of means from color palette to casting and dialogue it does a remarkable job at capturing the political economy. One thing I learned (so far, it hasn’t all appeared yet) is that it could have been much, much worse but the Russians avoided the worst scenario with a combination of bravery, smarts and luck.
The number of cancer deaths from Chernobyl appears to be quite low. The WHO estimated an additional 9,335 deaths with about half of those coming from workers and nearby residents and other half more distant impacts, other estimates are higher. More recent analysis, however, suggests that Chernobyl and its aftermath had relatively small but significant effects across a large number of people. Here are two recent papers:
Chernobyl’s Subclinical Legacy: Prenatal Exposure to Radioactive Fallout and School Outcomes in Sweden by Almond, Edlund and Palme.
Abstract: We use prenatal exposure to Chernobyl fallout in Sweden as a natural experiment inducing variation in cognitive ability. Students born in regions of Sweden with higher fallout performed worse in secondary school, in mathematics in particular. Damage is accentuated within families (i.e., siblings comparison) and among children born to parents with low education. In contrast, we detect no corresponding damage to health outcomes. To the extent that parents responded to the cognitive endowment, we infer that parental investments reinforced the initial Chernobyl damage. From a public health perspective, our findings suggest that cognitive ability is compromised at radiation doses currently considered harmless.
and The long-run consequences of Chernobyl: Evidence on subjective well-being, mental health and welfare by Danzer and Danzer.
Abstract: This paper assesses the long-run toll taken by a large-scale technological disaster on welfare, well-being and mental health. We estimate the causal effect of the 1986 Chernobyl catastrophe after 20 years by linking geographic variation in radioactive fallout to respondents of a nationally representative survey in Ukraine according to their place of residence in 1986. We exclude individuals who were exposed to high levels of radiation—about 4% of the population. Instead, we focus on the remaining majority of Ukrainians who received subclinical radiation doses; we find large and persistent psychological effects of this nuclear disaster. Affected individuals exhibit poorer subjective well-being, higher depression rates and lower subjective survival probabilities; they rely more on governmental transfers as source of subsistence. We estimate the aggregate annual welfare loss at 2–6% of Ukraine’s GDP highlighting previously ignored externalities of large-scale catastrophes.
Hat tip: Jennifer Doleac and Wojtek Kopczuk.
Virginia book fact of the day
College students at UVA checked out 238,000 books during the school year a decade ago; last year, that number had shrunk to just 60,000.
On Left Straussianism
We might therefore say that the left intellectual becomes the left Straussian when they decide that, in addition to sometimes filtering their own public speech to advance an ideological agenda, they’re additionally responsible for “protecting” the public from being exposed to conversations not disciplined by political strategy. To the extent that their own ideas are not already disciplined by such a strategy, they limit discussion of them to close friends and sympathetic colleagues.
And:
In each case, thoughtful criticism of an author’s argument—for being confused, or incomplete—was overshadowed by the left-Straussian assertion that, regardless of whether the argument was true or reasonable, it was “irresponsible” for the author to make it in public.
And:
Those who engage in such tactics would never endorse Strauss’s hard distinction between the elect few and the unthinking many—at least not explicitly. But the care they take to pre-screen intellectual material indicates that they share his dark foreboding about the “costs” of public intellectual conversations reflecting rather than repressing the complexities of private ones. Attempting to marginalize or disqualify intellectual arguments itself implies a gap between the commentator, who trusts themselves to evaluate the arguments in question, and their imagined audience, who is assumed to lack either the tools or the ability to do so unaided. Left Straussians may not believe that they are philosopher-kings but they repudiate, in practice and increasingly even in theory, the possibility of the philosopher-reader.
Here is the full piece by Anastasia Berg and John Baskin, via Agnes Callard.
Revisiting the Global Decline of the (Non-Housing) Labor Share
That is a new paper by Germán Gutiérrez and Sophie Pitony. I am on the road and have not had a chance to go through this, but the abstract is of interest:
We identify two undocumented measurement challenges affecting corporate sector labor shares outside the United States: the inclusion of dwellings and the inclusion of self-employed workers in the corresponding sectoral accounts. Both issues have become more important over time, biasing corporate labor shares downward. We propose two methods to correct for these challenges and obtain `true’ non-housing labor share series. Contrary to common wisdom, the corrected series exhibit stable labor shares across all major economies, except the US, where the corrected labor share declines by 6 percentage points since 1980.
For the pointer I thank Ilya Novak.
Monday assorted links
Girardian sentences to ponder
We also find that stronger peer effects are exerted by more price-sensitive individuals. This positive correlation suggests that the elasticity of aggregate demand is substantially larger than the elasticity of individual demand. Through this channel, peer effects reduce firms’ markups and, in many models, contribute to higher consumer surplus and more efficient resource allocation.
That is from a new NBER working paper by Michael Bailey, Drew M. Johnston, Theresa Kuchler, Johannes Stroebel, and Arlene Wong.
Bloat Does Not Explain the Rising Cost of Education
In Why Are The Prices So D*mn High? Helland and I examine lower education, higher education and health care in-depth and we do a broader statistical analysis of 139 industries. Today, I will make a few points about education. First, costs in both lower and higher education are rising faster than inflation and have been doing so for a very long time. In 1950 the U.S. spent $2,311 per elementary and secondary public school student compared with $12,673 in 2013, over five times more (both figures in $2015). The rate of increase was fastest in the 1950s and 1960s–a point to which I will return later in this series.
College costs have also increased dramatically over time. For this book, we are interested in costs more than tuition because we want to know what society is giving up to produce education rather than who, in the first instance, is paying for it. Costs are considerably higher than tuition even today, although in recent years tuition has been catching up. Essentially students and their parents have been paying an increasing share of the increasing cost of higher education. Moreover, as with lower education, costs have been rising for a very long period of time.
I will take it as given that the explanation for higher costs isn’t higher quality. The evidence on tests scores is discussed in the book:
It is sometimes argued that how we teach has not changed but that what we teach has improved in quality. It is questionable whether studies of Shakespeare have improved, but there have been advances in biology, computer science, and physics that are taught today but were not in the past. However, these kinds of improvements cannot explain increases in cost. It is no more expensive to teach new theories than old. In a few fields, one might argue that lab equipment has improved, which it certainly has, but we know from figure 1 that goods in general have decreased in price. It is much cheaper today, for example, to equip a classroom with a computer than it was in the past.
The most popular explanation why the cost of education has increased is bloat. Elizabeth Warren and Chris Christie, for example, have both blamed climbing walls and lazy rivers for higher tuition costs. Paul Campos argues that the real reason college costs are growing is “the constant expansion of university administration.” Redundant administrators are also commonly blamed for rising public school costs.
 The bloat theory is superficially plausible. The lazy rivers do exist! But the bloat theory requires longer and lazier rivers every year, which is less plausible. It’s also peculiar that the cost of education is rising in both lower and higher education and in public and private colleges despite very different competitive structures. Indeed, it’s suspicious that in higher education bloat is often blamed on competition–the “amenities arms race“–while in lower education bloat is often blamed on lack of competition! An all-purpose theory doesn’t explain much.
More importantly, the data reject the bloat theory. Figure 8 shows spending shares in higher education. Contrary to the bloat theory, the administrative share of spending has not increased much in over thirty years. The research share, where you might expect to find higher lab costs, has fluctuated a little but also hasn’t risen much. The plant share which is where you might expect to find lazy rivers has even gone down a little, at least compared to the early 1980s.
 Nor is it true that administrators are taking over the public schools, see Figure 10.
Compared with teachers and other staff, the number of principals and administrators is vanishingly small, only 0.4 per 100 students over the 1950–2015 period. It is true, if one looks closely, that the number of principals and administrators doubled between 1970 and 1980. It is unclear whether this is a real increase or a data artifact (we only have data for 1970 and 1980, not the years in between during this period). But because the base numbers are small, even a doubling cannot explain much. A bloated little toe cannot explain a 20-pound weight gain. Moreover, the increase in administrators was over by 1980, but expenditures kept growing.
If bloat doesn’t work, what is the explanation for higher costs in education? The explanation turns out to be simple: we are paying teachers (and faculty) more in real terms and we have hired more of them. It’s hard to get costs to fall when input prices and quantities are both rising and teachers are doing more or less the same job as in 1950.
We are not arguing, however, that teachers are overpaid!
Indeed, it is part of our theory that teachers are earning a normal wage for their level of skill and education. The evidence that teachers earn substantially above-market wages is slim. Teachers’ unions in public schools, for example, cannot explain decade-by-decade increases in teacher compensation. In fact, most estimates find that teachers’ unions raise the wage level by only approximately 5 percent. In other words, teachers’ unions can explain why teachers earn 5 percent more than similar workers in the private sector, but unions cannot explain why teachers’ wages increase over time.
If the case for unions as a cause of rising teacher compensation in public schools is weak, it is nonexistent for increased compensation for college faculty, for whom wage bargaining is done worker by worker with essentially no collective bargaining whatsoever.
A signal to where we are heading is this:
If increasing labor costs explain the increasing price of education but teachers are not overpaid relative to similar workers in other industries, then increasing labor costs must lead to higher prices in the education industry more than in other industries.
Read the whole thing. Next up, health care.
Addendum: Other posts in this series.
China fact of the day
We find that party members on average hold substantially more modern and progressive views than the public on issues such as gender equality, political pluralism, and openness to international exchange.
That is from Chengyuan Ji and Junyan Jiang, via the excellent Kevin Lewis. Of course this may partly explain why China’s rising middle class is not so outright enthusiastic for democratization.
The minimum wage and migration decisions
This paper investigates the local labor supply effects of changes to the minimum wage by examining the response of low-skilled immigrants’ location decisions. Canonical models emphasize the importance of labor mobility when evaluating the employment effects of the minimum wage; yet few studies address this outcome directly. Low-skilled immigrant populations shift toward labor markets with stagnant minimum wages, and this result is robust to a number of alternative interpretations. This mobility provides behavior-based evidence in favor of a non-trivial negative employment effect of the minimum wage. Further, it reduces the estimated demand elasticity using teens; employment losses among native teens are substantially larger in states that have historically attracted few immigrant residents.
That is from a 2014 paper by Brian C. Cadena, and here is Jorge Pérez Pérez:
I find that areas in which the minimum wage increases receive fewer low-wage commuters. A 10 percent increase in the minimum wage reduces the inflow of low-wage commuters by about 3 percent.
And here is one bit from a research paper by Terra McKinnish:
Low wage workers responded by commuting out of states that increased their minimum wage.
Via the excellent Jonathan Meer, you don’t hear about this evidence as much as you should.
Sunday assorted links
1. How Huawei became a smartphone giant (podcast, and sign-up page).
2. New results on the cost of the China trade war.
3. China is more carbon efficient than you might think (The Economist).
4. eSports a bubble?
5. Will Wilkinson on regional renewal (NYT).
6. Ross Douthat on how liberalism loses (NYT).
Bias against indigenous Americans?
We conducted a resume correspondence experiment to measure discrimination in hiring faced by Indigenous Peoples in the United States (Native Americans, Alaska Natives, and Native Hawaiians). We sent employers realistic 13,516 resumes for common jobs (retail sales, kitchen staff, server, janitor, and security) in 11 cities and compared callback rates. We signaled Indigenous status in one of four different ways. We almost never find any differences in callback rates, regardless of the context. These findings hold after numerous robustness checks, although our checks and discussions raise multiple concerns that are relevant to audit studies generally.
That is from Patrick Button and Brigham Walter in their new NBER Working Paper.
Viral Markets in Everything

The Persistence of Chaos is an Airgapped Samsung 10.2-Inch Blue Netbook (2008) that is running Windows XP SP3 and 6 pieces of malware that collectively caused some $95 billion in damages. One of the worms trapped on the computer, for example, is:
SoBig was a worm and trojan that circulated through emails as viral spam. This piece of malware could copy files, email itself to others, and could damage computer software/hardware. This piece of malware caused $37B in damages and affected hundreds of thousands of PCs.
The terms of sale include the following:
The sale of malware for operational purposes is illegal in the United States. As a buyer you recognize that this work represents a potential security hazard. By submitting a bid you agree and acknowledge that you’re purchasing this work as a piece of art or for academic reasons, and have no intention of disseminating any malware. Upon the conclusion of this auction and before the artwork is shipped, the computer’s internet capabilities and available ports will be functionally disabled.
The current high bid is over $1,200,750.
Hat tip: Paul Kedrosky.
Yes there has been an American male culture collapse
During the last 50 years, the earnings of prime-age men in the United States have stagnated and dispersed across the education distribution. At the same time, the labor-force participation rates of men without a college education have steadily declined. While wage and participation trends are often linked for this population, we have argued that this connection cannot solely be the result of an inward labor demand shift across a stable and elastic labor supply curve. The uncompensated labor supply elasticities implied by the twin declines of wages and participation during the 1970s, 1980s, and 2000s appear too large to be plausible. Moreover, labor-force participation continued to decrease in the 1990s while wages were rising. While the increasing availability of disability benefits and the increase in the fraction of the population with prior incarceration exposure may help explain some of the participation decline, we doubt either factor can explain the bulk of the decline.
We have argued that more plausible explanations for the observed patterns involve feedbacks from male labor demand shocks, which often involve substantial job displacement, to worker adjustment frictions and to family structure. Marriage rates, and corresponding male labor supply incentives, have also fallen for reasons other than changing labor demand. Moreover, we have noted interactions between labor demand and disability benefit take-up, and between mass incarceration and family structure. These factors have all converged to reduce the feasibility and desirability of stable employment, leading affected men—who may not often be eligible for disability or other benefits—to participate sporadically in the labor market and depend primarily on family members for income support.
That is from the concluding remarks of Ariel J. Binder and John Bound, in the most recent Journal of Economic Perspectives. I’ll just highlight one bit again, bolded by me:
At the same time, the labor-force participation rates of men without a college education have steadily declined. While wage and participation trends are often linked for this population, we have argued that this connection cannot solely be the result of an inward labor demand shift across a stable and elastic labor supply curve.
In case you missed it.
Saturday assorted links
Why Are the Prices So D*MN High?
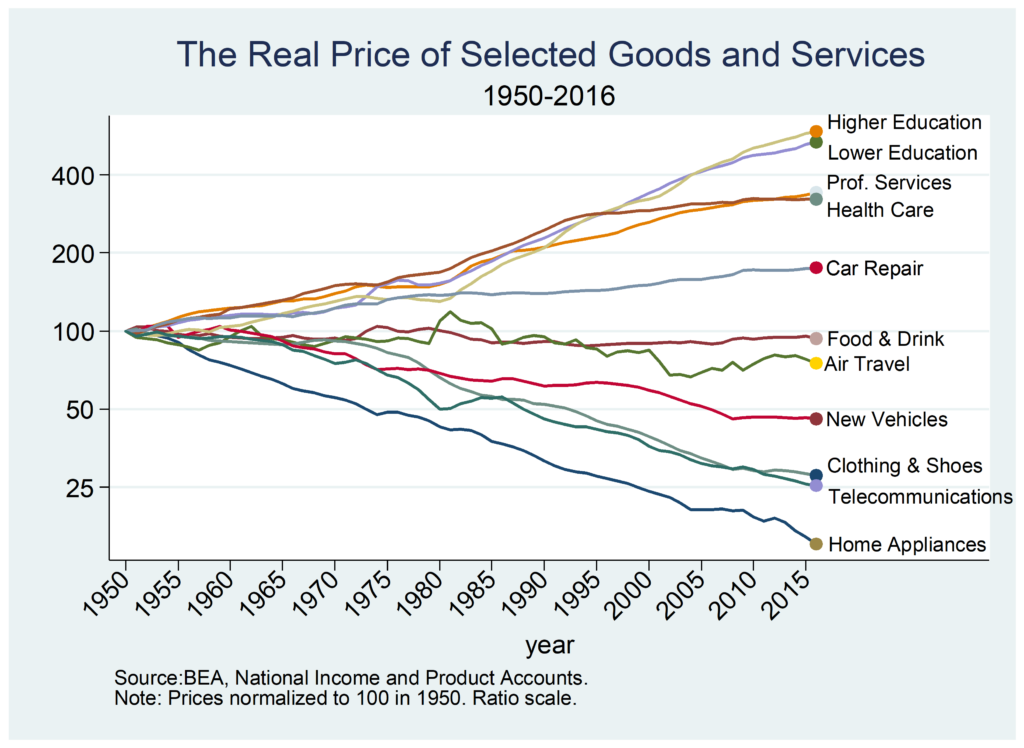
Why have some prices increased since 1950 by a factor of four while other prices have decreased by a factor of four? Technology is making so many goods and services much cheaper than in the past–that seems to be the normal situation–so why do some industries seem not only to be not progressing but actually retrogessing? As Scott Alexander put it, why are some industries so weird?
Those are the questions that motivated my latest piece, a short book with Eric Helland just released by the Mercatus Center titled, Why are the Prices so D*mn High?
In approaching this question I had some ideas in mind. I assumed that regulation, bloat and bureaucracy, monopoly power and the Baumol effect would each explain some of what is going on. After looking at this in depth, however, my conclusion is that it’s almost all Baumol effect. That conclusion radically changes one’s evaluation of price increases and decreases over the long run and it changes what, if anything, one might try to do to address such price changes.
Next week I will examine some of the evidence that pushes me towards this verdict. I’ll also take a closer look at the Baumol effect, which is mistakenly called the cost disease.
Let’s note here, however, what we need to explain. For the most part, we don’t see quick, big changes in prices that then level off. That in itself is interesting since policy tends to be discontinuous. We might expect a big regulation, for example, to cause a big increase in prices as industries adjust but then growth should return to normal. Instead, what we see and need to explain is slow, steady rising relative prices that happens over decades. Indeed, in some cases, such as education, prices have been increasing faster than average for more than a century! Puzzle over that over the long weekend. More next week!
Addendum: Other posts in this series.