Month: July 2014
Markets in everything: jeans designed by lions and tigers
A Japanese jeans maker has found a new way of capitalizing on zoo animals. Zoo Jeans is producing jeans “designed by dangerous animals.” Denim is wrapped around tires, which are then thrown to the lions who enjoy ripping and biting at the material. This produces that all-important designer, distressed look.
Rather than simply being a marketing gimmick, there is actually value in this from an animal welfare perspective. Involving lions and the zoo’s other large carnivores in the activity is part of what’s called environmental enrichment. This is the provision of stimuli to help improve well-being. It’s a win-win activity for many zoos, who can make alternative profits from their animals, which tend to be used to provide extra facilities for them.
The full story is here, and for the pointer I thank Gary Rosen.
Average Stock Market Returns Aren’t Average
The average investor in the stock market will earn less than the average stock market return–this is true even without taking into account any behavioral biases. A reasonably diversified portfolio of stocks can expect to earn 7% per year on average. Thus, it’s easy to see that the expected payoff from investing $100 and holding for 30 years is $100*(1.07)^30=$761.23. The expected payoff, however, is subject to a lot of uncertainty–even on a diversified portfolio the standard deviation is about 20% annually. Many people think that uncertainty washes out when you buy and hold for a long period of time. Not so, that is the fallacy of time diversification. Although the average return becomes more certain with more periods you don’t get the average return you get the total payoff and that becomes more uncertain with more periods.
To illustrate I ran 100,000 simulations of a 30 year stock market investment with a 7% return and a 20% standard deviation. The mean payoff across all 100,000 runs was $759.58 (recall the theoretical mean is $761.23 so we are spot on). But now consider the following. What percentage of returns would you guess lost money, i.e. had a total payoff after 30 years of less than $100?
After 30 years, 8.9% of all returns lost money!!! In terms of recent debates, (average) r>g does not mean that wealth accumulates automatically. Fortunes can be lost even when the averages are in your favor.
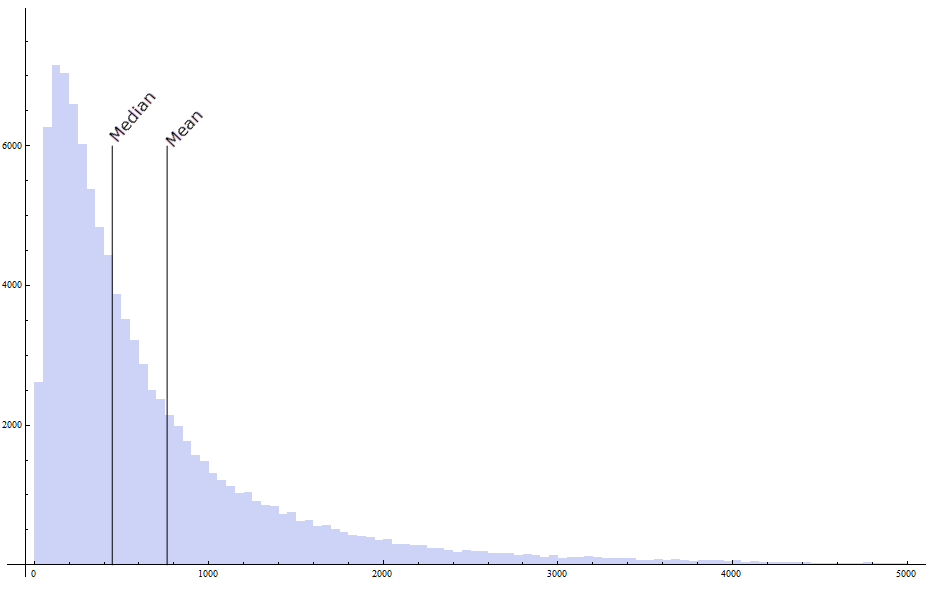
Perhaps even more surprisingly what percentage of investors would you guess earned less than the average payoff of $761.23? An amazing, 69.2% of investors earned less than the average. The median payoff in my simulation was only $446.85, so the median return was not 7% but 5.1%. The average investor earned less than the average return.
The point is subtle and widely misunderstood. Here’s a simple example. Suppose that the average return is 10%. If $100 is invested for two periods the average payoff is $100*(1.1)^2=$121. But on average that is not what happens. More typically, you get say 0% in the first period and 20% in the second period, i.e. $100*(1.0)*(1.2)=$120. Notice that the average return is exactly the same, 10%, but the total payoff is smaller in the second and more realistic case–an application of Jensen’s inequality–so the average investor earns less than the average payoff. The difference here is only $1 but over 30 years that seemingly small difference accumulates.
If most investors earn less than the average it follows immediately that a few must earn more than the average. Lady luck is a bitch, she takes from the many and gives to the few. Here is the histogram of payoffs. The right-hand tail is long. Indeed, I am only showing part of the tail as there were payoffs as high as $25,000. Most investors earn less than the mean payoff.
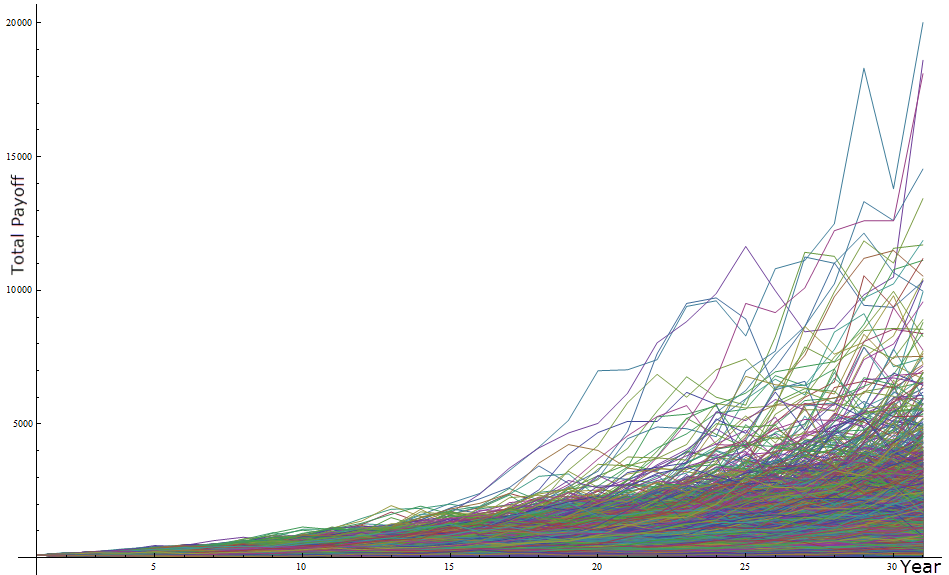
And here is a line plot showing the portfolio accumulation over time for a sample of 10,000 runs. Note two things. First, the variance of the total payoff is increasing over time and second, the total payoff is highly right (upper)-tailed.
Addendum: There is some evidence that stock market returns are mean reverting, as makes sense if discount factors are mean reverting. Taking mean-reversion into account would moderate the numbers somewhat but would not change the qualitative results. Moreover, we don’t have many independent 30-year data points so in my view we shouldn’t put too much weight on mean-reversion.
Using Big Data to find employees who will not leave
This is for call center operators:
The results are surprising. Some are quirky: employees who are members of one or two social networks were found to stay in their job for longer than those who belonged to four or more social networks (Xerox recruitment drives at gaming conventions were subsequently cancelled). Some findings, however, were much more fundamental: prior work experience in a similar role was not found to be a predictor of success.
“It actually opens up doors for people who would never have gotten to interview based on their CV,” says Ms Morse. Some managers initially questioned why new recruits were appearing without any prior relevant experience. As time went on, attrition rates in some call centres fell by 20 per cent and managers no longer quibbled. “I don’t know why this works,” admits Ms Morse, “I just know it works.”
The rest of the Tim Smedley FT story is here, via Peter Sahui.
*Economics of the Undead* (arrived in my pile)
The editors are Dow James and Glen Whitman and the subtitle is Zombies, Vampires, and the Dismal Science. Authors include Steven Horwitz, Sarah Skwire, Ilya Somin, and also Hollis Robbins, “Killing Time, Dracula and Social Coordination”, among others.
Marijuana sentences to ponder: new data from the Colorado experiment
“This study finds total marijuana demand to be much larger than previously estimated,” Colorado’s study concluded.
And this, which I think suggests the laws in other states are binding for many consumers:
Colorado concluded that visitors account for 44 percent of recreational marijuana retail sales in the Denver area. In the mountains and other vacation spots, visitors to Colorado account for 90 percent of recreational dispensary traffic.
And this, which sounds tautologous, but is not:
“Heavy users consume marijuana much more often, and more intensely, than other consumers,” the study concluded.
Overall heavy users seem to account for about seventy percent of total demand. Here is some detail:
Colorado’s market numbers bore out survey estimates that most marijuana is consumed by heavy daily users. For example, survey authors estimated that a third of all Colorado’s pot consumers use the drug less than once a month. But that group accounts for just 0.3 percent of the total market, analysts concluded.
The full story is here, the study itself is here. For the pointer I thank C., who I believe is not part of that seventy percent of market demand.
Sentences to ponder
Countless times, I have found that it is only during the physical exam that patients reveal what is truly on their mind. Whether it is the cough that they are reminded of now that I am listening to their lungs, or whether it is the domestic violence, the eating disorder or the genital symptoms that they feel comfortable revealing once we are in a more intimate setting — there is something about touch that changes the dynamic.
That is from Danielle Ofri’s interesting piece on the physical exam in medicine, via Jeffrey Flier.
Assorted links
2. The first robotic parking valet. And soccer robots.
3. Honest ontology, fantasy, and comedy. And here is Eric Kaplan’s forthcoming book Does Santa Exist?: A Philosophical Investigation. He is connected to the show Big Bang Theory.
4. The Japanese television conspiracy (speculative). And in defense of replication.
What exactly is going wrong?
WHEN do individual pieces of data become a trend? In the past few days, we have seen a surprise 1.3% monthly slump in British factory output, a 1.8% decline in German industrial production, a 1.7% decline in France, and a 1.2% drop in Italy. No one can blame the weather for these numbers, as they did for first-quarter US GDP.
European stocks have been weaker, although a cumulative 2.6% drop is hardly a sign of panic.
That is from Buttonwood. The Espirito Santo debt problem in Portugal is probably not a major event in its own terms, but slotted into this overall picture it is worrying nonetheless. Is this what the end of QE looks like? Or is this turn in events caused by something else?
My re-read of *Harriet the Spy*, by Louise Fitzhugh (spoilers)
1. From 1964: “Eleven-year-old Harriet M. Welsch is obnoxious. She dresses like a boy, throws temper tantrums, swears at her parents and thinks terribly unkind thoughts. She refuses to eat anything but tomato sandwiches for lunch. She even invents her own middle initial.”
2. She also keeps a notebook, spies on everyone, and writes down the truth about them. Her notebook is made public and she is disgraced, until making a comeback as the elected editor of the school newspaper (though see below). At the end she learns that some lying is necessary.
3. One message of this book is that writers, and journalists in particular, are neurotics. And liars. A more core message is that heroines are allowed to be nasty and tell the truth. Harriet throws a pencil in the face of Beth Ellen. Compare this with the goody two-shoes Nancy Drew.
3b. “Harriet…Are you still writing down mean things about people?” “No. I am writing my memoirs.” When I first read this book at age ten or so, I didn’t get the jokes. Note also the phallic wurst joke on p.105. Food/sex references run throughout, and there is a running contrast between Harriet’s duty to be an onion (hard, gets cut down the middle) with her desire to instead do nothing but munch on tomato sandwiches.
4. The opening of the book makes Harriet sound like an macroeconomist: “Harriet was trying to explain to Sport how to play Town. “See, first you make up the name of the town. Then you write down the names of all the people who live in it. You can’t have too many or it gets too hard.””
5. Harriet the infovore announces her intention to know “everything in the world, everything, everything.”
6. On p.278 author Fitzhugh indicates to us that she is not herself telling us the entire truth about growing up. It is yet more brutal than this book is allowed to let on. After that page, everything which happens in the text is a lie, designed to make the casual reader feel better and to sell more copies. Harriet is not in fact voted editor of the school newspaper and not allowed to publish her critical rants to general acclaim with only a few retractions. This is a Straussian text and it makes fun of the reader’s willingness to believe in happy endings. The opening “make believe” scene mirrors these later deceptions.
7. This short essay compares Harriet to To Kill a Mockingbird. Other commentators stress that Louise Fitzhugh, the author, was a lesbian and perhaps Harriet is a budding lesbian too (she dresses like a boy and has a tomboyish haircut). I view Sport’s father, who is obsessed with getting a $$ advance for his book, as the stand-in character for Fitzhugh (start at p.260 and see also p.52 on the obsession with writing and money). Luxury is portrayed as corrupting and leading to indolence, so becoming a successful writer is a self-destructive process, noting that Fitzhugh herself stagnated after this hugely successful book.
8. In this book parents are typically indifferent, brutally indifferent I would say, toward their children.
9. In the movie version “…Harriet competes against Marion Hawthorne to see who has a better blog.”
10. This is a deep work, rich in jokes, and more than worthy of its iconic status. I am very glad to have reread it.
The decline of drudgery and the paradox of hard work
That is a new paper (pdf) by Brendan Epstein and Miles S. Kimball, the abstract is here:
We develop a theory that focuses on the general equilibrium and long-run macro-economic consequences of trends in job utility. Given secular increases in job utility, work hours per capita can remain approximately constant over time even if the income effect of higher wages on labor supply exceeds the substitution effect. In addition, secular improvements in job utility can be substantial relative to welfare gains from ordinary technological progress. These two implications are connected by an equation flowing from optimal hours choices: improvements in job utility that have a significant effect on labor supply tend to have large welfare effects.
I view this hypothesis as consistent with my view that we should be utility optimists but revenue pessimists. Here is a closely related paper I once wrote with Alex.
The pointer is from Claudia Sahm.
Visible Prices
(VP) is a digital humanities project, currently in development, for a collection of prices drawn from literary and historical sources in 18th and 19th century England. Users will be able to search for information relating to a specific good or service, or a specific amount of money. For example, a query for 3 shillings in 1789 reveals that in London, that amount would purchase a bushel of wheat, a quarto of translations from Diderot, or a day’s services of a crippled or deformed child as a companion to an adult beggar. My intent is for the database to make use of the influx of printed texts onto the web in facsimile format, in databases like Google Books, the Hathi Trust Digital Library, Eighteenth Century Collections Online, the British Newspapers Collection, and the London Times Online Archive, to name only a few. Though entry privileges are currently restricted, the goal is to eventually make it possible for registered users to enter data in the process of individual research or classroom activities; and thus to make it possible for researchers specializing in other time periods and regions to extend the scope of the database.
The pointer is from Pam Regis.
Assorted links
1. Are people biased against black dogs?
2. Kickstarter in Everything (potato salad, average is over).
3. Jeff Koons employs 128 people.
5. Mining the streets of New York City. And peer review rings at the Journal of Vibration and Control.
6. Another 677 pp. from William Vollmann and can you guess the topic?
7. Is there a strategic trade policy justification for Ex-Im?
Arrived in my Twitter feed
Notice of:
How Adam Smith Can Change Your Life: An Unexpected Guide to Human Nature and Happiness
By Russ Roberts, now available for pre-order.
Some simple game-theoretic questions about Hamas rockets
Haaretz reports that some of the current rockets have a range of 150 km, which is longer than most of what has been fired in the past. So here is my question: when do those rockets become sufficiently powerful and numerous that they can close down Tel Aviv Airport, which is of course the main route in and out of Israel, especially for well-off people. If that can happen, is this not like a housing bubble game, where things can go very sour very quickly? And in the meantime, will the Israel government attempt “lower the mean, increase the variance” strategies, if only to forestall what is to them an obviously unacceptable outcome, namely that Hamas can could close Tel Aviv airport at will? Are we already at the point of seeing such mean-reducing strategies? If not, how much worse will things be when we get there?
The Gaza offensive
In March 1917, the EEF [Egyptian Expeditionary Force, from Great Britain] launched offensive operations in southern Palestine.
That is from the new and noteworthy book by Kristian Coates Unrichsen, The First World War in the Middle East. I wouldn’t say it is a fun book, but it is clear, well-written, and very good background reading on a number of today’s crises.