Category: Data Source
The minimum wage and the Great Recession
I believe Card and Krueger will and should win Nobel Prizes, but their work is also not the last word on the minimum wage, especially during weak labor markets. Here is the most recent study, by Jeffrey Clemens:
I analyze recent federal minimum wage increases using the Current Population Survey. The relevant minimum wage increases were differentially binding across states, generating natural comparison groups. I first estimate a standard difference-in-differences model on samples restricted to relatively low-skilled individuals, as described by their ages and education levels. I also employ a triple-difference framework that utilizes continuous variation in the minimum wage’s bite across skill groups. In both frameworks, estimates are robust to adopting a range of alternative strategies, including matching on the size of states’ housing declines, to account for variation in the Great Recession’s severity across states. My baseline estimate is that this period’s full set of minimum wage increases reduced employment among individuals ages 16 to 30 with less than a high school education by 5.6 percentage points. This estimate accounts for 43 percent of the sustained, 13 percentage point decline in this skill group’s employment rate and a 0.49 percentage point decline in employment across the full population ages 16 to 64.
Do any of you see an ungated version? In any case I hope this receives the media attention it deserves. Will it?
What was 19th and early 20th century TFP? Which was America’s most inventive decade?
There is a new paper (pdf) on this question by Bakker, Krafts, and Woltjer, here is the abstract:
We present new estimates of TFP growth at the sectoral level and an amount of sectoral contributions to overall productivity growth. We improve on Kendrick (1961) in several ways including expanding the coverage of sectors, extending estimates to 1941, and better accounting for labor quality. The results have important implications including that the pattern of productivity growth was generally ‘yeasty’ rather than ‘mushroomy’, that the 1930s did not experience the fastest TFP growth of the 20th century, and that the role of electricity as a general purpose technology does not explain the ‘yeastiness’ of manufacturing in the 1920s.
They instead suggest that TFP growth is rising throughout the 1920s through the 1960s, a view which I cannot quite agree with. I view the 1960s as a time when previous ideas spread widely, rather than the key years of invention.
My strictly intuitive, historical guess is that TFP growth peaked in the 1890-1930 period, give or take.
More generally, the TFP concept is most useful, and most exact, when TFP growth is low rather than high. The bigger TFP growth might be, the more you have to worry about unmeasured changes in labor quality, and also worry about what is “technical progress embodied in capital goods” as opposed to “sheer accumulation.” When there is less progress, these measurement issues are smaller too.
I am most skeptical of TFP estimates for China, even if you believe the underlying statistics. Compared to “the global frontier,” TFP growth for China has been pretty close to zero, for centuries. Compared to “the frontier within China”…er…Chinese TFP growth and “embodied accumulation of foreign ideas through savings and investment” become pretty much the same thing. The distinction theory was trying to create then has been abolished.
So I’m not convinced by the results of this paper, but they are a useful corrective to excess certainty about Alexander Field and the previous view that the peak of American TFP was the 1930s.
In any case, thumbs up to any paper which uses the word “yeasty.”
Do Juvenile Curfews Increase Crime?
Washington, DC has a juvenile curfew law. Anyone “under the age of 17 cannot remain in or on a street, park or other outdoor public place, in a vehicle or on the premises of any establishment within the District of Columbia during curfew hours.” (There are exemptions for juveniles accompanied by a parent and for travel for jobs (no detours allowed.))
Curfew laws keep some juveniles off the streets during curfew hours but which ones? The criminals seem the least likely to be deterred and with fewer people on the street perhaps the criminals are emboldened.
The DC curfew switches from midnight to 11 pm on Sept 1 of every year. In a working paper, Jennifer L. Doleac and Jillian Carr test the effect of DCs juvenile curfew on gun violence by looking at the number of gunshots heard in the 11pm to midnight “switching hour” just before and just after Sept 1. From a summary:
…the September 1 change provides a clean natural experiment. If curfews reduce gun violence, then when the curfew shifts to 11:00 p.m. rather than midnight, gunfire between 11:00 p.m. and midnight should go down. Does it?
Just the opposite. Using data on gunfire incidents from ShotSpotter (acoustic gunshot sensors that cover the most violent neighborhoods in D.C.), we find that after the curfew switches from midnight to 11:00 p.m., the number of gunshot incidents increases by 150 percent during the 11:00 p.m. hour. This amounts to 7 additional gunfire incidents city-wide per week, during that hour alone. Jane Jacobs was right: the deterrent effect of having lots of people out on the streets is powerful. This makes juvenile curfew policies counter-productive.
The use of ShotSpotter data is innovative and avoids some problems with issues of police enforcement. Calls to 911, however, don’t show the same pattern as the ShotSpotter data which is worrying.
I’d also like to see more information on the proposed mechanism. Is it really the case that significantly fewer people are out on the streets at say 11:30 pm after the curfew has been lowered to 11pm than when the curfew was set at midnight? The curfew only directly affects people under 17 and, as noted above, there are quite a few exemptions. Also what are the ages of those typically arrested on the basis of ShotSpotter alerts?
By the way, on a typical day in DC there are almost 15 gunfire incidents heard by ShotSpotter (data here, the authors report 8 but that may be from a restricted sample). A lot of gunfire is heard around a handful of schools. The ShotSpotter system is quite accurate. Although it misses some shots it distinguishes shots from car backfires better than people do. I also found this note from the Washington Post amusing in a frightening way:
About a third of detected gunshot incidents in the city happen on New Year’s Eve or around July 4. Officials explain the high rate as celebratory gunfire.
Spite
This is from Eliana Zeballos, who is on the job market this year from UC Davis and appears to be a very interesting candidate. Here is part of the abstract of her job market paper (pdf):
The experimental games were conducted in Bolivia among285 dairy farmers. Results show that when participants were presented with their ranking and the earnings of others in their group, those below the group mean increased their effort whereas those above the group mean decreased their effort. When destructive actions were allowed, 55 percent of the participants were willing to forego own-consumption in order to burn others’ output; 58 percent were victims of destructive actions and lost, on average, a third of their earnings. There is an asymmetry in the direction of destruction: almost all of the highest earners suffered some destruction while only a quarter of the lowest earners were victims of destructive actions. Finally, the threat of destructive actions reduced the highest earning participants’ effort by 5.8 percent.

For the pointer I thank Ben Southwood.
NinjaEconomics on Tinder (from the comments)
I’m not convinced women who are on Tinder who say “no hookups” actually mean that.
First of all, Tinder is for young people and young women don’t have a hard time meeting men in real life. So, for someone to go to a place that is known to be where casual sex seekers meet and announce THEY aren’t at all interested in casual sex seems fishy. If I’m not in the market to buy shag carpeting that’s full of vomit and fleas, I don’t go shopping at the used carpet store that specializes in shag carpeting that’s full of vomit and fleas. I certainly don’t go there and ask where I can find silk hand-knotted rugs from Central Persia for basically the same price and get offended when I’m offered vomit and fleas.
More likely, these women are interested in hooking up (or at least open to some opportunities of it happening) but don’t want their friends and colleagues knowing this should someone come across their profile, so like the Playboy readers who buy the magazine for the articles, these women are on Tinder “just for the lulz.”
Which brings me to my second point: Despite their loud claims, women are not on Tinder to find their husbands. Getting married is easy. It is so easy that almost anyone can do it! Very unattractive, very poor, mentally unstable people can do it. Now, you might not be able to marry someone who meets all the required characteristics but if Tinder women were sincere in husband-hunting, rather than just stating “no hookups”, which is spectacularly unhelpful, they’d actually list their requirements in order to speed up the process.
And, if the internet (and online dating in particular) is so hostile to women, why would any reasonable woman who has above-average chances of meeting someone in traditional ways subject herself to unbearable and avoidable sexual harassment online? If she’ll assume the risk of verbal abuse from potential suitors, she must be very motivated to meet someone using this platform and I doubt she will be in the top 5-10% of all available women (or perhaps she’s more resilient and online interactions are not emotionally harmful to her). So compared to the top 5-10% of the men she’s vying for (attractive, educated, marriage-minded men in their 20s are quite rare), she won’t have the upper hand, so making brusque dismissals right out of the gate just seems more like an attempt to demonstrate dominance. The point is, the women who really don’t want to hook up aren’t on Tinder and the ones who do say that on Tinder aren’t being honest.

That is from NinjaEconomics, the original post is here.
What happens if you expand higher education?
This is based on Italian data from the 1960s:
However, I also find that those induced to enroll earned no more than students in earlier cohorts who were denied access to university. I reconcile these surprising results by showing that the education expansion reduced returns to skill and lowered university learning through congestion and peer effects. I also demonstrate that apparently inframarginal students were significantly affected: the most able of them abandoned STEM majors rather than accept lower returns and lower human capital.
Uh-oh. The good news, however, is that the children of these individuals seem to have ended up in higher-paying jobs.
That is from Nicola Bianchi (pdf), he is now at Northwestern. For the pointer I thank Robin Gaster.
How much does assortative mating matter for income inequality?
The astute Kurt Mitman noted that Greenwood, et.al. issued a later corrective (pdf) to their earlier 2014 AER piece (ungated here), and therefore their estimates in that piece (which I very recently cited) contain no real information. I apologize for having cited the piece, as I was not aware of the later correction.
It would be incorrect to conclude, however, that assortative mating has no connection to income inequality. Some of the other evidence for that connection is cited in my piece, but more specifically Greenwood et. al. have since revised their own revision (pdf), and produced a more integrated model. A gated version of this piece was just published in American Economic Journal: Macroeconomics this last week.
In the integrated model, the focus is on family and labor supply decisions more generally. For instance, let’s say a couple keeps its income up by not divorcing: is that “no divorce” or rather “assortative mating” which is contributing to income inequality? After all, high income, high education, well-paired couples do divorce a lot less, so that may be a semantic distinction from a causal point of view. The authors suggest that their integrated family model explains about a third of the rise in income inequality from 1960-2005 (see for instance p.46, with a summary of their overall approach and results starting on p.47), and assortative mating is very much a part of their bigger-picture story.
Why did economists ignore the rise of the top one percent for so long?
Daniel Hirschman at the University of Michigan wrote a dissertation chapter on that topic, in the field of sociology, here is the abstract:
In the 2000s, academics and policymakers began to discuss the growth of top incomes in the United States, especially the “top 1%.” Newly analyzed data revealed that top income earners in the 1990s received a larger share of income than at any point since the Great Depression, and that their incomes had begun a dramatic upward climb in the early 1980s. This paper investigates why it took two decades for this increase in top incomes to become politically and academically salient. I argue that experts assembled two “regimes of perceptibility” (Murphy 2006) for producing knowledge about income inequality, and that neither of these regimes was capable of tracking movements in top incomes. Macroeconomists focused on labor’s share of national income, but did not examine the distribution of income between individuals. Labor economists, on the other hand, drew on newly available survey data to explain wage disparities in terms of education, age, work experience, race, and gender. By relying on surveys, these scholars unintentionally eliminated top incomes from view: surveys top-coded high incomes, and thus were incapable of seeing changes in the top 1%. Studies of top incomes that relied on income tax data thus fell by the wayside, creating the conditions under which experts, policymakers, and the public alike could be surprised by the rise of the 1%. This historical narrative offers insights into the political power of economic expertise by clarifying the complex linkages between observations, stylized facts, causal theories, and policy attention.
The chapter is here (pdf). There is too much general background in this piece, and it is silly for the author to say that macroeconomics did not exist before 1930. Most of all, that the import of the growth of incomes in the top one percent remains underexplained I think is outside his framework. Nonetheless there are some points of interest throughout the chapter.
Here is Dan Hirschman’s home page.
Pointers run through Marshall Steinbaum and Henry Farrell.
Were the Civil War and abolition a surprise?
More than I had thought. And Lincoln really was the difference maker:
…prior to 1860, few political events seemed to affect slave prices, and even the Dred Scott decision had only a small and temporary effect. After Lincoln’s nomination for the presidency, slave prices fell, and they continued to fall once the war commenced. The overall decline in slave prices was large (more than one-third from their 1860 peak) and occurred prior to any battle losses by the South.
That is from the new AER piece by Calomiris and Pritchett. There is an ungated version here (pdf).
New results on the minimum wage and inequality
There is a new paper in American Economic Journal: Applied Economics by David H. Autor, Alan Manning, and Christopher L. Smith, here is the abstract:
We reassess the effect of minimum wages on US earnings inequality using additional decades of data and an IV strategy that addresses potential biases in prior work. We find that the minimum wage reduces inequality in the lower tail of the wage distribution, though by substantially less than previous estimates, suggesting that rising lower tail inequality after 1980 primarily reflects underlying wage structure changes rather than an unmasking of latent inequality. These wage effects extend to percentiles where the minimum is nominally nonbinding, implying spillovers. We are unable to reject that these spillovers are due to reporting artifacts, however.
Here are earlier, ungated versions of the paper. Overall my read of this is that many people are leaping in too quickly and making unsupported claims about how the minimum wage is connected to income inequality.
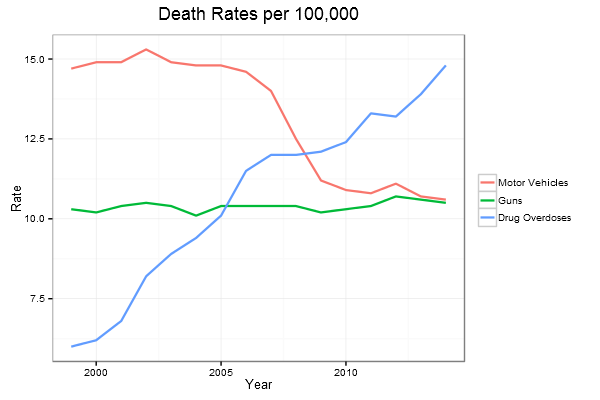
Death trends
China disappeared fact of the day
Publishers of the China Minxin purchasing managers index said they will stop updating the gauge of manufacturing to make a “major adjustment” to their calculations, dealing a second setback in recent months to investors looking for an early read on the economy.
Release of the unofficial purchasing managers index jointly compiled by China Minsheng Banking Corp. and the China Academy of New Supply-side Economics will be suspended starting this month, the Beijing-based academy said in an e-mailed statement Monday, about six hours before the latest monthly data were scheduled for release.
Six hours, I guess they found some big mistakes in the number really late. The article is here.
For pointers I thank Christopher Balding and Chris Anstey.
Cross-national differences in genes and socioeconomic status
That is a newly published piece by Elliot M. Tucker-Drob and Timothy C. Bates, the abstract is this:
A core hypothesis in developmental theory predicts that genetic influences on intelligence and academic achievement are suppressed under conditions of socioeconomic privation and more fully realized under conditions of socioeconomic advantage: a Gene × Childhood Socioeconomic Status (SES) interaction. Tests of this hypothesis have produced apparently inconsistent results. We performed a meta-analysis of tests of Gene × SES interaction on intelligence and academic-achievement test scores, allowing for stratification by nation (United States vs. non–United States), and we conducted rigorous tests for publication bias and between-studies heterogeneity. In U.S. studies, we found clear support for moderately sized Gene × SES effects. In studies from Western Europe and Australia, where social policies ensure more uniform access to high-quality education and health care, Gene × SES effects were zero or reversed.
I would put it this way: genes matter more when you equalize environmental influences in the United States, but not in many other countries. By the way, this also holds if you control for race and the greater racial diversity of the United States. One possibility is that there are greater environmental differences to be equalized in America in the first place, compared to say the Netherlands, one country where the gradient is quite different. In any case an interesting piece.
For the pointer I thank Michelle Dawson.
Can intelligence explain the overrepresentation of liberals and leftists in American academia?
How is that for a provocative, comment-inducing article title? That’s a new piece in Intelligence by Noah Carl, the abstract is this:
It is well known that individuals with so-called liberal or leftist views are overrepresented in American academia. By bringing together data on American academics, the general population and a high-IQ population, the present study investigates how much of this overrepresentation can be explained by intelligence. It finds that intelligence can account for most of the disparity between academics and the general population on the issues of abortion, homosexuality and traditional gender roles. By contrast, it finds that intelligence cannot account for any of the disparity between academics and the general population on the issue of income inequality. But for methodological reasons, this finding is tentative. Furthermore, the paper finds that intelligence may account for less than half of the disparity on liberal versus conservative ideology, and much less than half the disparity on Democrat versus Republican identity. Following the analysis, eight alternative explanations for liberal and leftist overrepresentation are reviewed.
Do please note that the “intelligent” point of view need not be the correct one, it is simply the view held by individuals who measure as intelligent.
Most of all, modern America has a not-very-self-aware academic culture, which is far more insular than it likes to believe. A good deal of what American academics believe springs from their culture, not from their intelligence per se.
For the pointer I thank Daniel B. Klein.
Assortative mating is returning to Gilded Age levels
There is a new and interesting paper by Robert D. Mare on this topic, here is the abstract:
Patterns of intermarriage between persons who have varying levels of educational attainment are indicators of socioeconomic closure and affect the family backgrounds of children. This article documents trends in educational assortative mating throughout the twentieth century in the United States, using socioeconomic data on adults observed in several large cross section surveys collected between 1972 and 2010 and on their parents who married a generation earlier. Spousal resemblance on educational attainment was very high in the early twentieth century, declined to an all-time low for young couples in the early 1950s, and has increased steadily since then. These trends broadly parallel the compression and expansion of socioeconomic inequality in the United States over the twentieth century. Additionally, educationally similar parents are more likely to have offspring who themselves marry within their own educational level. If homogamy in the parent generation leads to homogamy in the offspring generation, this may reinforce the secular trend toward increased homogamy.
Having read through the paper, my immediate wonder was to what extent assortative mating is an effect rather than a cause of inequality?
The pointer is from Claire Lehmann.