Category: Data Source
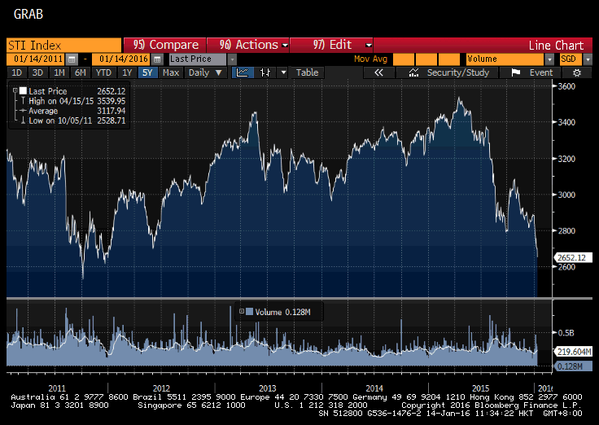
Singapore (China) fact of the day
One of the worst-hit markets has been Singapore’s ; lost over a THIRD of its value from April last year
Three Words – Any Place
Here’s an amazing new tool. what3words has identified every one of the 57 trillion 3mx3m squares on the entire planet with just three, easy to remember, words. My office, for example, not my building but my office, is token.oyster.whispering. Tyler’s office just down the hall is barons.huts.sneaky. (Especially easy to remember if you recall this is Tyrone’s office as well.)
Every location on the earth now has a fixed, easily-accessible and memorable address. Unpopulated places have addresses for the first time ever, of course, but now so do heavily populated places like favelas in Brazil where there are no roads or numbered houses. In principle, addressing could be done with latitude and longitude but that’s like trying to direct people to web sites with IP addresses–not good for humans.
Algorithms have assigned words to avoid homophones (sale & sail) and to place similar combos far from one another to aid in error detection. Simpler, more common words are used to address more populated areas and longer words are used in unpopulated areas.
Moreover the three word addresses are available not just in English but in French, Spanish, Portuguese, Swahili, Russian, German, Turkish and Swedish with more languages on the way. The addresses in other languages are not translations but unique 3 word addresses in those languages.
All of this is available in a small app so that it can be used even offline on a simple smartphone. Find your address here.
Hat tip: The Browser.
China estimate of the day
…it appears that there was roughly $750 billion of capital outflow in 2015
The Aaron Back WSJ story is here, or try through here. And here is a Victor Shih paper (pdf) on the fragility of China’s reserves, from 2011 but still of relevance. One key point is that high wealth inequality in China makes capital flight easier to accomplish.
By the way, here is a profound Andrew Batson post on why China is not specializing much in its exports. That is the good news, the bad news is that Chinese leveraging does not seem to be slowing down at all.
The Importance of Growth Rates
Here’s the latest video from our MRUniversity course on the Principles of Macroeconomics; it’s an introduction to growth rates and comparing countries across time.
Do you get grumpy when it is warmer than seventy degrees Fahrenheit?
I don’t think climate change is the right framing for this effect, nonetheless this is an interesting result, with the subtitle “Evidence from a billion tweets.” Here is the abstract:
What is the welfare cost of environmental stress? The change in amenity values resulting from temperature increases may be a substantial unaccounted-for cost of climate change. Because there is no explicit market for climate, prior work has relied on cross-sectional variation or survey data to identify this cost. This paper presents an alternative method of estimating preferences over nonmarket goods which accounts for unobserved cross-sectional and temporal variation and allows for precise estimates of nonlinear effects. Specifically, I create a rich dataset on hedonic state: a geographically and temporally dense collection of updates from the social media platform Twitter, scored using a set of both human- and machine-trained sentiment analysis algorithms. Using this dataset, I find limited evidence of temperature effects on hedonic state in low temperatures and strong evidence of a sharp decline in hedonic state above 70◦F. This finding is robust across all measures of hedonic state and to a variety of specifications.
That is the job market paper (pdf) by Patrick Baylis, a job candidate from UC Berkeley.
And here is a new result that Canadians are more polite on Twitter, I wonder what happens if you control for temperature…
For the pointer I thank Samir Varma.
Amazon eBook questions that are rarely asked
Why are Amazon ebook reviews from US readers more important than reviews from international readers?
Have you noticed that reviews from Amazon.com are aggregated across all other international Amazon sites, but that the reverse is not true? If someone kindly posts a review of a book on Amazon.co.uk, it is stuck there, and not aggregated to Amazon.com. Why? Is a UK review less valuable than a US review? Are reviews from Canadians, Australians or India inferior to US reviews?
Source here, via Sofia Tania.
Why is it hard to measure the value of soccer players?
Max Mendez Beck emails me:
Given the advent of statistics in sports that occurred in the last five years, I am struck by how well soccer works as a metaphor for current epistemological debates regarding the use (and primacy) of quantitative versus qualitative data in social science research. While the three major American sports (football, basketball, and baseball) have been overtaken by a quantitative obsession (count how many tables and numbers you see on an average ESPN show), soccer is emblematic of a sport that is quite difficult to measure quantitatively.
Consider how easy it is to determine who did well in an average NBA game without needing to even watch it. You can just look at points, assists, rebounds, steals, turnovers, etc. In soccer, individual statistics are almost nonexistent. Even as major sports channels have attempted to incorporate quantitative measures into their soccer broadcasts–for example, by showing the number of kilometers a player has covered when he gets subbed out (a pretty uninformative statistic on its own)–these numbers have not caught on with the regular fan.
While in basketball everyone debates about who “the best ever” is by referring to their career averages in points, field goal percentage, PER, etc. In soccer the only statistic that is ever used is goals scores, and goals scored is only one small dimension of a player, even smaller if he is not a striker. It would be silly to judge Andrés Iniesta or Zinedine Zidane on how many goals they scored in a season.
So what is it about soccer that makes it so hard to quantify? Or what makes American sports so easy to measure? One obvious answer is the length of the units that can be easily separated and analyzed. In basketball its a maximum of 24 seconds, in baseball its essentially a pitch (or an at bat), and in football its each snap. For soccer, the only apparent unit to separate out is the 45 minute halftime mark. Changes in possession could be another measure, but even then a team’s single possession could be several minutes long.
However, the real challenge comes in measuring individual accomplishments. Just recently I was watching a Barcelona game and Iniesta clearly was having an amazing game (as was mentioned several times by the announcer), and yet the things that made him have a great game were only describable in words and not numbers. There was a beautiful and sudden “regate” or dribble around a defender before he passed it on to a teammate for a quick counter attack. There was the beautiful pass between defenders that led to an assist for the first goal. There was the sudden change in direction and over the top pass to the other side of the field that put the defenders on their heels. Many of these moves are incredibly situational; they have to do with the rhythm of the game and the need to speed it up or slow it down. Nothing in the boxscore could truly capture these attributes.
So the question is: Is soccer something that can’t be measured in numbers?
Here are various readings on the topic.
The Declining Dominance of Lawyers in U.S. Federal Politics
From Nick Robinson at Harvard Law:
Abstract:
While the ubiquity of lawyers in U.S. electoral politics has frequently been noted, there has been almost no research on how their prevalence has changed over time, why these changes might have occurred, or the consequences of any such shift. This working paper helps fill this gap by using a unique data set that extends over two hundred years to chart the occupational background of members of the U.S. Congress. It finds that lawyers’ dominance in Congress is in slow, but steady, retreat. In the mid-19th century almost 80% of members of Congress were lawyers. By the 1960s this had dropped to a bit under 60%, and by 2015 it was slightly under 40%. The working paper also details variation of the prevalence of lawyers in Congress on the basis of geographic region, gender, race, and political party. It puts forward a set of arguments about why lawyers have traditionally had such success in U.S. federal electoral politics, including the politicization of the US justice system and the comparative advantage lawyers have over other occupations in terms of access to resources and career flexibility. It then claims that lawyers’ electoral decline may be the result of changes within the legal profession, as well as the emergence of a competing full-time professionalized political class, comprised of political aides and members of civil society, who have made politics a career. It ends by briefly exploring some of the potential ramifications of this decline on the legal profession.
File under…”division of labor is limited by the extent of the market.”
Hat tip goes to www.bookforum.com.
How much of the math gender gap is due to culture?
Natalia Nollenberger, Núria Rodríguez-Planas, and Almudena Sevilla have a paper on this topic (click on the AEAweb pdf), presented at this year’s AEA meetings, the core result is this:
This paper investigates the effect of gender-related culture on the math gender gap by analysing math test scores of second-generation immigrants, who are all exposed to a common set of host country laws and institutions. We find that immigrant girls whose parents come from more gender-equal countries perform better (relative to similar boys) than immigrant girls whose parents come from less gender-equal countries, suggesting an important role of cultural beliefs on the role of women in society on the math gender gap. The transmission of cultural beliefs accounts for at least two thirds of the overall contribution of gender-related factors [emphasis added by TC].
I believe we will learn more yet when women stop improving, relative to men, at chess. But so far that has not yet happened.
China fact of the day
To recap, China’s total debt is about $28 trillion, or roughly half the world’s entire debt.
Jim Edwards has further information.
How much did World War II boost post-war growth?
Petros Milionis and Tamas Vonyo have a new paper on this question (click through to the first pdf here), the effect was a major and long-lasting one, here is part of the abstract:
…this reconstruction process was an important driver of growth during the post-war decades, not only in Europe but globally, and its impact on growth rates lasted until the mid 1970s. Moreover, a counterfactual analysis suggests that in the absence of the reconstruction effect global growth rates from 1950 to 1975 would have been on average 40% lower and only slightly higher than those observed during the years from 1975 to 2000.
Here is Alex’s MRU video on the Solow growth model, part two here.
Are the disabled less loss averse?
Arbel, Ben-Shahar, and Gabriel have a newly published paper on this topic, here is the abstract:
Research findings show that disabled persons often develop physical and psychological mechanisms to compensate for disabilities. Coping mechanisms may not be limited to the psychophysiological domain and may extend to cognitive bias and loss aversion. In this study, we apply unique microdata from a natural policy experiment to assess the role of loss aversion in home purchase among nondisabled and disabled households. Results of survival analysis indicate that the physically disabled are substantially less loss averse in home purchase. Furthermore, loss aversion varies with other population characteristics and attenuates with degree of disability. Findings provide new evidence of diminished cognitive bias and more rational economic decision-making among the physically disabled.
There are alternative versions of the paper here.
For the pointer I thank the excellent Kevin Lewis.
Nobel Prize poll results
The MRUniversity booth at the AEA meetings polled economists on a walk-by basis, as to who should win the next Nobel Prize. The top five on the list were:
Robert Barro
Paul Romer
Esther Duflo
Partha Dasgupta
William Nordhaus
Do check out the whole list at the link. Yoram Bauman was perhaps the dark horse candidate.
Religion is good for the poor, installment #1437
From Jessica Shiwen Cheng and Fernando Lozano:
What is the role of religious institutions and religious workers in the racial earnings gap in the United States? In this paper we explore the relationship between childhood exposure to religious density, as measured with the number of religious workers at the state level, and the labor market outcomes of the worker thirty years later. We use data that spans over fifty years to identify changes in earnings due to early exposure to religion: our first source of identification uses changes in these two variables within states, and our second source of identification uses states’ differences by following workers who moved to a different state. Our results suggest that living in a state with a an extra clergy member for each 1,000 habitants increases the earnings of black workers by 1.7 to 3.6 percentage points relative to white workers.. In addition we show that this relationship is robust to different measures of exposure to religious density, and that these estimates increase to 7.6 percentage points when the change on religious density is defined exclusively increasing an extra black religious workers for each 1,000 habitants. Finally, we estimate a series of robustness tests that suggest that these results are not due to spatial sorting across states, nor to secular time trends associated with changes in labor market outcomes for black American workers.
You can find a copy of the paper if you dig through this link to the AEA program, look under Jan 03, 2016 12:30 pm, Hilton Union Square, Powell A & B, National Economic Association/American Society of Hispanic Economist. The title of the paper is”Racial/Ethnic Differences in Self-Identification and Income Inequality,” but do any of you know a better, more direct link?
As I see things, to overgeneralize perhaps rather grossly, Democratic economists are more concerned with social and intellectual status, often in good ways, than are many conservatives. The former group therefore is led to violate strictures of science through the omission of inconvenient truths, rather than through outright denialism or simply “making things up.” The benefits of religion, including sometimes extreme religion, are one example of that. On the Left, redistribution is a popular remedy for poverty, religion much less so.
Regdata, a new database of the regulatory state
There is a new and very important regulatory database now published and on-line:
RegData: A numerical database on industry-specific regulations for all United States industries and federal regulations, 1997–2012
Omar Al-Ubaydli and Patrick A. McLaughlin
Abstract
We introduce RegData, formerly known as the Industry-specific Regulatory Constraint Database. RegData annually quantifies federal regulations by industry and regulatory agency for all federal regulations from 1997–2012. The quantification of regulations at the industry level for all industries is without precedent. RegData measures regulation for industries at the two, three, and four-digit levels of the North American Industry Classification System. We created this database using text analysis to count binding constraints in the wording of regulations, as codified in the Code of Federal Regulations, and to measure the applicability of regulatory text to different industries. We validate our measures of regulation by examining known episodes of regulatory growth and deregulation, as well as by comparing our measures to an existing, cross-sectional measure of regulation. Researchers can use this database to study the determinants of industry regulations and to study regulations’ effects on a massive array of dependent variables, both across industries and time.
Here is the published piece. Here is a working paper version. Here is the database itself. Here is background and an explanation of different versions of the data base.