Category: Data Source
India fact of the day
One statistic above all explains the excitement India kindles: just 18 people in every 1,000 own a car. In China the figure is 58, according to the World Bank, while in most European countries it is more than 500. “India’s level of car ownership per capita is even lower than in Sudan, or Afghanistan,” says Tomas Ernberg, head of Volvo in India. “So in the long term there is bound to be growth, enormous growth.”
The market is also strikingly new. Barely 20 years ago India’s “Licence Raj” restricted aspirant motorists to two basic choices: the grand Hindustan Ambassador, an imitation of the venerable British Morris Oxford; and the boxy Maruti-Suzuki 800 hatchback, the country’s first (and then only) people’s car.
From the FT, here is more.
From the comments — on dynamism
Responding to this link, Ryan writes:
I think the secular decline in various measures of dynamism is a pretty important topic, largely because we haven’t been able to figure out what’s causing it. We’re seeing it not only in worker flows but also job flows, migration, startup rates, etc.
Industry composition effects make the puzzle even bigger–retail and services are typically more volatile than manufacturing, so the larger employment share they’re seeing means we should expect to see HIGHER rates of churning rather than lower (see http://updatedpriors.blogspot.com/2013/02/job-flows-industry-composition-and.html).
One thing that DOES help explain secular declines in gross flows is firm age stuff. Startup rates and employment shares among young firms are on secular decline (see http://updatedpriors.blogspot.com/2012/12/startups-and-great-recession.html); since dynamism typically declines as you go up through the age classes, lower young-firm activity means we should expect lower flows. But it’s not clear that this is a sufficient explanation; and, more importantly, it’s only explanatory in an accounting sense. We don’t know why entry is declining. And this is a secular trend, so common political explanations may not work.
Whether we should be worried really depends on what is causing all of this. After all, churning is costly. If churning is declining for good reasons, we should applaud it. But that may not be the case.
How sticky are wages anyway?
On the front of this new Elsby, Shin, and Solon paper (pdf) it reads “Preliminary and incomplete,” but if anything that is a better description of the pieces which have come before theirs. They have what I consider to be the holy grail of macroeconomics, namely a worker-by-worker micro database of nominal wage stickiness under adverse economic conditions, including the great recession and with over 40,000 workers, drawn from the Current Population Survey.
Here are a few results:
1. When looking at the distribution of nominal wage changes, there is always a spike at zero.
2. That said, the spike, ranging from six to twenty percent, isn’t as big as one might expect.
3. The fraction of hourly workers reporting a nominal wage reduction always exceeds ten percent, and the fraction of non-hourly workers reporting a nominal wage reduction always exceeds twenty percent.
3b. In 2007-2008, 37.1% of U.S. workers in the non-hourly sample experienced negative nominal wage changes. That’s a lot. In the following years that figure was over thirty percent. See Table 6 on p.24.
4. These figures are for workers who stay with the same employer for a year or more, and thus they are from sectors where nominal stickiness is especially likely. Overall nominal stickiness is probably considerably smaller than those figures indicate, as the broader pool of workers includes temps, those on commissions, those with short-term jobs, and so on.
5. If you compare the great recession to earlier downturns, “…initial evidence appears to be weak for a simple story in which the combination of downward stickiness in nominal wages and low inflation has generated high unemployment through excessive rates of job loss.” If it were primarily a story of sticky nominal wages, we should have expected layoff rates to be even higher than they were.
6. Overall wages are less sticky in the UK than in the U.S.; for instance “the proportion [of measured UK workers] experiencing nominal wage cuts regularly has run in the neighborhood of 20 percent.” (And here are some recent related results.)
7. Other studies with true microdata also find strongly procyclical real wages, often mediated through changes in nominal wages, including nominal wage declines.
8. The slowdown in real wage growth for U.S. women, during the great recession, follows puzzling patterns.
9. None of these figures include wage changes which take the form of changes in the quality of working conditions, chances of promotion, fringe benefits, and so on.
NB: This paper does not show nominal wages to be fully flexible, nor does it show that observed nominal wage changes were “enough” to re-equilibrate labor markets. Still, this paper should serve as a useful corrective to excess reliance on the sticky nominal wage hypothesis. Nominal wage stickiness is a matter of degree and perhaps we need to turn the dial back a bit on this one.
Note also that this paper need not discriminate against neo-Keynesian and monetarist theories, though it will point our attention toward “zero marginal revenue product” versions of the argument, in which case the flexibility of nominal wages simply doesn’t help much. Note also that such versions of the argument may have somewhat different analytic and policy conclusions than what we are used to expecting.
Addendum: Also from Solon, this time with Martins and Thomas, is this paper about Portugal (pdf), showing considerable nominal flexibility for entry wages in labor markets.
How critical are the early years of life?
“Early intervention” to benefit children is one of those sacred cows which I consider unproven and which also is cited in far too malleable a fashion. Here is a new paper by Alan Rushton, Margaret Grant, Julia Feast, and John Simmonds, probably gated for many of you, but worth a read if you can.
The abstract is too wordy, but the study is a follow-up on one hundred Chinese girls who first lived in Chinese orphanages, were later adopted into the UK, and who now are 40 to 50 years old. The orphanage involved deprivation and even some malnutrition (55% of sample). There was basic medical care and supervision, although no general one-to-one caregiver relationship.
Of the initial hundred children, 98 were still alive and 72 of those responded to the survey, which also involved extensive follow-up interviews.
Most entered the orphanage very early, in the first year of life, with a mean of three months old. Age at exit varied between eight months and 83 months, with a mean of 23 months, and with a mean of 20 months spent in the care of the orphanage.
Compared to a general sample of adopted British women, and also UK non-adopted women, the adopted Chinese women did not appear to be at greater risk of mental illness, nor did they appear to have elevated health risks. There were no statistically significant differences when it came to “life control” or “life satisfaction.”
This single study is hardly dispositive, but it should raise some skeptical eyebrows. Recovering from a bad start, in this data set, appears eminently possible, provided of course that the environment improves.
Addendum: Here are some observations on Gerard Debreu’s early life (jstor).
For the pointer I thank a loyal MR reader.
Big Data, Big Government, Big Brother
In addition to monitoring who you call and when, your email, and your internet searches the government also has access to all of your credit card purchases. We usually don’t think about purchases as communication but what people buy says more about most people than does their email. Buying behavior can be used to predict all manner of information about your political views, affiliations, sexual activity, marriage quality and much more.
We are not as wealthy as we thought we were (a continuing series)
From Ylan Q. Mui at The Washington Post:
American households have rebuilt less than half of the wealth lost during the recession, according to a new analysis from the Federal Reserve, hampering the country’s economic recovery.
The research from the St. Louis Fed shows that households had accumulated net worth totaling $66 trillion at the end of last year. After adjusting for inflation and population growth, the bank found that meant families on average have only made up 45 percent of the decline in their net worth since the peak of the boom in 2007.
In addition, most of the improvement was due to gains in the stock market, according to the report, primarily benefiting wealthy families. That means the recovery for most households was even weaker.
“A conclusion that the financial damage of the crisis and recession largely has been repaired is not justified,” the report stated.
Adjusting measures of economic output for health
This is the kind of argument which no one will successfully rebut, but no one really will take on and adopt either. Does that mean we are defective? Or is there simply ineffable wisdom in “how things have been done”? Must we keep closed all Pandora’s boxes?
Here is the abstract from Mark L. Egan, Casey B. Mulligan, and Tomas J. Philipson:
Many national accounts of economic output and prosperity, such as gross domestic product (GDP) or net domestic product (NDP), offer an incomplete picture by ignoring, for example, the value of leisure, home production, and the value of health. Discussed shortcomings have focused on how unobserved dimensions affect GDP levels but not their cyclicality, which affects the measurement of the business cycle. This paper proposes new measures of the business cycle that incorporate monetized changes in health of the population. In particular, we incorporate in GDP the dollar value of mortality, treating it as depreciation in human capital analogous to how NDP measures treat depreciation of physical capital. We examine the macroeconomic fluctuations in the United States and globally during the past 50 years, taking into account how depreciation in health affects the cycle. Because mortality tends to be pro-cyclical, fluctuations in standard GDP measures are offset by monetized changes in health; booms are not as valuable as traditionally measured because of increased mortality, and recessions are not as bad because of reduced mortality. Consequently, we find that U.S. business cycle fluctuations appear milder than commonly measured and may even be reversed for the majority of “recessions” after accounting for the cyclicality of health. We find that adjusting for mortality reduces the measured U.S. business cycle volatility during the past 50 years by about 37% in the United States and 46% internationally. We discuss future research directions for more fully incorporating the cyclicality of unobserved health capital into standard output measurement.
The NBER link is here, does anyone know of an ungated copy? Of course other forms of depreciation could be included as well (environmental?) and that too may smooth out business cycles, if we are willing to countenance such factors in the first place.
Sentences to ponder
For jazz players, there is a negative relationship between earnings and having a BFA or a MFA.
The quotation is from here (pdf), the original source is Thomas M. Smith, pdf of the underlying paper here. There are other interesting results in this paper as well. Do note that if you don’t end up as a jazz player the degree still correlates with higher earnings.
Stereotyping in Europe

Each column is interesting, for instance read down for “Most Compassionate.” It’s funny how many individuals do the same for themselves, I might add, in what has to be one of the simplest and most common of all intellectual mistakes.
Those results are from the new Pew report, summarized by David Keohane here. The French are growing increasingly disillusioned with the European project, and on key questions the French see the world as the Italians or Spanish do, not the Germans. And there is this: “The report also takes down a few German stereotypes. Apparently, Germans are among the least likely of those surveyed to see inflation as a very big problem and the most likely among the richer European nations to be willing to provide financial assistance to other European Union countries that have major financial problems.”
Save the World Bank’s *Doing Business* report
Yesterday I received an email from Michael Klein:
We are writing to you about the World Bank’s Doing Business report. Published since 2003 the report benchmarks 185 countries annually on key dimensions of the legal and regulatory environment for small businesses. It has supported numerous reforms all over the world helping small businesses and employment.
There is currently a serious risk that the report may be abolished or severely curtailed as part of an ongoing review that will be finished in the next few weeks. The report has always been subject to controversy as it highlights shortcomings that countries may not appreciate. The World Bank’s President and its Board of Executive Directors will consider the future of the report in the next few months.
We would like to ask you to support an open letter to the World Bank’s President and its Executive Directors supporting the Doing Business project and recommending general directions for the future. The letter (see below) is informed by our review of the arguments about Doing Business (attached).
This is our private initiative and without any institutional affiliation.
Please, reply by return email, if you agree to support the open letter. If you wish, indicate in which capacity you want to be mentioned. If you want to forward this email to ask others also to support the letter, please, ask them to reply to this email address ([email protected]) so that we can keep an accurate record of support.
I support the report very much and I have found it useful in my own work. It is one of the best things the World Bank does, and you can read more about the report here. Please do email at the above address if you think your support can be useful. Here is some back story on how China is seeking to push around the Bank on the ratings. Here is FT coverage of the same.
Private Schools in Developing Countries
Tina Rosenberg has an excellent piece on private schooling in developing countries at the NYTimes blog:
In the United States, private school is generally a privilege of the rich. But in poorer nations, particularly in Africa and South Asia, families of all social classes send their children to private school….
BRAC used to be an acronym for Bangladesh Rural Advancement Committee, but now the letters stand alone. It was founded in 1972 to provide relief after Bangladesh’s war of liberation. Although you’ve probably never heard of it, BRAC is the largest nongovernmental organization in the world, with some 100,000 employees, and it services reach 110 million people.
…And since 1985, it has run schools… BRAC has more than 1.25 million children in its schools in Bangladesh and six other countries, and it is expanding.
BRAC students, in fact, do better than their public-school counterparts….BRAC students are more likely to complete fifth grade — in 2004, 94 percent did, as opposed to 67 percent of public school students. (The BRAC number is now about 99 percent.) On government tests, BRAC students do about 10 percent better than public school students — impressive, given that their population is the most marginalized. (emphasis added).
In my own work on private schools in India I also found suggestive evidence that private schools–mostly very small, urban slum schools–produced better outcomes than their public counterparts (paper (pdf), video).
Is the Fed able to offset “austerity”?
David Beckworth serves up another very good blog post and directs us to this graph of nominal gdp; it seems aggregate demand has been recovering steadily:
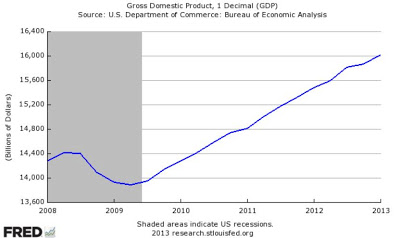
Scott Sumner directs us to Marcus Nunes, but here is a quotation from Scott:
In 1937 real government purchases recoiled 4.2% and the economy tanked. In 2012 real government purchases were 4.8% below the 2010 level and the recovery is slow!
Surely something is going on that´s making comparable ‘fiscal austerity’ so much less damning in 2012 than in 1937.
And that ‘something’ is monetary policy.
Here are further remarks from Scott.
The decline in public investment at the state and local levels
Matt Yglesias has the scoop, and here is his chart:
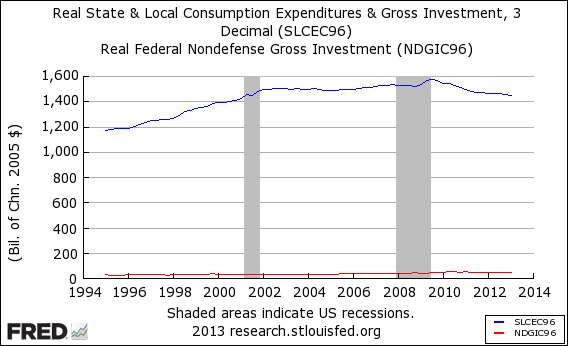
You can think of that as another way of viewing the lost economic decade of the oughties.
American Austerity (and Growth)
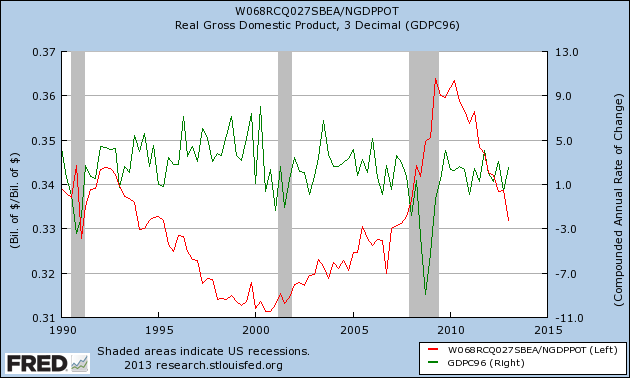
The red line in the chart above is Paul Krugman’s preferred measure of austerity, the ratio of overall government expenditure to potential GDP. The idea of potential GDP has plenty of problems and biases but I want to be more than fair. In his post on American Austerity Krugman warns:
the truth is that federal stimulus is years behind us, while state and local governments have cut back, so the overall story is one of fiscal contraction that’s smaller than in Europe, but not by that much.
…Spending is down to what it was before the recession, and also significantly lower than it was under Reagan. Bear in mind that in the years since the recession began we’ve seen a significant number of boomers reach retirement age, which would ordinarily have led to rising spending, not to mention the effects of rising health care costs. Bear in mind also that the private sector is still deleveraging, which means that government should be spending more to help sustain the economy. So this is actually a picture of very bad policy. (emphasis added)
I assume that by very bad policy what Krugman means is a policy that is likely to have very bad effects. Hence, I have added to Krugman’s graph the growth rate of real gdp (annual rate). I don’t see the very bad effects. In the 1990s growth was strong even while “austerity” was increasing (falling red line) [as this sentence appears to be driving people mad do note that it is a factual description of the data from which I do not draw a conclusion]. More recently, we have seen a big increase in austerity according to Krugman and his measure but although there has been no boom, growth has remained modest. As Justin Wolfers tweeted this morning with the strong jobs report, “the recovery has been remarkably persistent, and resilient,” albeit not rapid. Scott Sumner argues that this is bye, bye Keynesian multiplier as monetary policy stands triumphant (also here) which is one possible interpretation.
“Investigating America’s elite”
That is a new paper by Jonathan Wai, from the latest issue of Intelligence, with the subtitle “Cognitive ability, education, and sex differences,” and here is the abstract:
Are the American elite drawn from the cognitive elite? To address this, five groups of America’s elite (total N = 2254) were examined: Fortune 500 CEOs, federal judges, billionaires, Senators, and members of the House of Representatives. Within each of these groups, nearly all had attended college with the majority having attended either a highly selective undergraduate institution or graduate school of some kind. High average test scores required for admission to these institutions indicated those who rise to or are selected for these positions are highly filtered for ability. Ability and education level differences were found across various sectors in which the billionaires earned their wealth (e.g., technology vs. fashion and retail); even within billionaires and CEOs wealth was found to be connected to ability and education. Within the Senate and House, Democrats had a higher level of ability and education than Republicans. Females were underrepresented among all groups, but to a lesser degree among federal judges and Democrats and to a larger degree among Republicans and CEOs. America’s elite are largely drawn from the intellectually gifted, with many in the top 1% of ability.
I don’t yet see this paper on-line, but here is some summary coverage.