Category: Data Source
China fact of the day
Financial services accounted for a whopping 20 per cent of China’s economic growth in the second quarter of 2015, according to a recently released breakdown of GDP data by the Chinese National Bureau of Statistics.
Of course that is not a good sign for third quarter gdp, or fourth quarter gdp for that matter. The FT article is here.
Why is the American prison population going up so much?
Slate has an interesting interview with Leon Nayfakh speaking to John Pfaff, here is the critical excerpt from Pfaff:
What appears to happen during this time—the years I look at are 1994 to 2008, just based on the data that’s available—is that the probability that a district attorney files a felony charge against an arrestee goes from about 1 in 3, to 2 in 3. So over the course of the ’90s and 2000s, district attorneys just got much more aggressive in how they filed charges. Defendants who they would not have filed felony charges against before, they now are charging with felonies. I can’t tell you why they’re doing that. No one’s really got an answer to that yet. But it does seem that the number of felony cases filed shoots up very strongly, even as the number of arrests goes down.
You will note that district attorneys are relatively politically independent at this level. And this:
But just letting people out of prison—decarcerating drug offenders—will not reduce the prison population by as much as people think. If you released every person in prison on a drug charge today, our state prison population would drop from about 1.5 million to 1.2 million. So we’d still be the world’s largest incarcerating country; we’d still have an enormous prison population.
Keep in mind that some in prison on drug charges are actually violent offenders who did a plea bargain down to a drug charge.
The interview also offers evidence against alternative explanations of the boom in the prison population, such as putting the blame on longer sentences. Here is Pfaff’s home page and his related papers.
Is this the most effective development program in history?
I will turn the mike over to Chris Blattman:
It’s a business plan competition for $50,000, and I think it’s a contender.
In 2011 the Nigerian government handed out 60 million dollars to about 1200 entrepreneurs, and three years later there are hundreds more new companies, generating tons of profit, and employing about 7000 new people.
David McKenzie did the incredible study.
24,000 Nigerians applied, the government selected about 6,000 to get some training and advice to develop their plan, the plans were scored, and about 1,200 were funded. They got an average of $50,000 each. Fifty thousand US dollars! Who the hell thought this was a good idea?
All the highest scoring plans got funded automatically, but McKenzie worked with the government to randomize among the runners up.
The results are amazing. Looking just at the people who had no firm to begin with, 54% of the control group have a firm after three years, compared to 93% of those who got the grant. And these firms are bigger. Just 11% of the control group have a firm with at least 10 employees, compared to 34% of those who got the grant. They’re more profitable too.
If you are the President of a developing country, one of the great problems that will occupy your thoughts is: how to get more people jobs? How to grow domestic businesses? Even I, Mr. Cash, did not think big grants would be the answer.
These entrepreneurs are not the deserving poor, to be sure, but the employees are more likely to be. They made $143 a month, so they probably weren’t the poorest of society. But 7000 people earning $7 a day they might not have earned otherwise—that is something. And this ignores the multiplier: the expansion of suppliers, the people employed by the 7000 employees spending that money, the taxes collected by the state, and so on.
Two other things occur to me:
-
What if, in 10 years, we learn that after all the struggle to build infrastructure and services and other stuff was bullshit, and ALL ALONG we should have just been funneling more cash to the middle and bottom. I do not believe the cashonistas should go so far, but today I wonder.
-
I should start responding to all the emails I get from Nigerians promising me $50,000 in cash.
The culture that is America (Googling for God)
In the United States, there is more interest in heaven than in hell, at least based on searches. There are 1.5 times more searches for “heaven” than “hell,” 2.8 times as many searches asking what heaven looks like than what hell looks like, and 2.75 times as many searches asking whether heaven is real than whether hell is real.
…Relative to the rest of the country, for every search I looked at, retirement communities search more about hell. In retirement communities, there are a similar number of searches asking to see visuals of hell as visuals of heaven.
And:
There are 4.7 million searches every year for Jesus Christ. The pope gets 2.95 million. There are 49 million for Kim Kardashian.
That is from Seth Stephens-Dawidowitz.
British inequality: not what you think
A new paper by the Institute for Fiscal Studies (IFS) shines a new light on how well the British tax system redistributes incomes over people’s lifetimes, in addition to using the cross-sectional approach. It presents several interesting findings. For a start, it finds that lifetime inequality in Britain has always been much lower than cross-sectional inequality (see first chart). This is because the poorest in any given year are not always poor for their entire lives; the IFS’s simulations suggest that those who, over the whole of their life, are in the lowest 10%, only spend an average of a fifth of their lifetimes at the bottom.
More startlingly, policies that increased or cut welfare expenditure appear to have had very little impact on lifetime inequality. For instance, while the benefit cuts of the late 1980s reduced benefits and increased cross-sectional inequality, it had a much more muted effect on lifetime inequality. And, similarly, although Gordon Brown’s massive expansion of means-tested tax credits in the 2000s reduced cross-sectional inequality, they had very little impact on cutting lifetime inequality.
The paper also finds that the redistribution performed by the British welfare state is, to a great extent, smoothing incomes over people’s lifetimes rather than over their entire lives. Whereas 36% of individuals receive more in benefits than they pay in tax in any given year, only 7% do so over their lifetimes. Over half of all redistribution is simply across peoples’ lifespans; the young pay in while they work, and take out when they retire (see second chart).
The post is from Free Exchange. I do not yet see the paper on the website of the Institute for Fiscal Studies, does anyone know what is up?
China question of the day
Visits to medical institutions, hospital visits, and primary medical facilities are growing at 2.98%, 5.40%, and 1.56% respectively.
That is from Christopher Balding, read the whole post. And that is for an aging population and in a setting where the demand for health care is for structural reasons growing rapidly. Furthermore the use of traditional Chinese medicine is declining rapidly, fifteen percent this year from Balding’s citation.
Now let’s say the Chinese economy is about fifty percent services, though the exact number can be debated. And we know that manufacturing PMI is down seven months in a row.
What is your estimate of the overall rate of economic growth in China? The overall rate of growth six months or a year from now?
In the middle of this post you will find Scott Sumner on China’s growth.
Here is Krugman’s excellent post on how large China spillovers will be. I say watch for who is exposed to the sudden weekend ten to fifteen percent devaluation. Lots of other EM currencies have gone down by about that amount, why should China be so different or immune? The Chinese government isn’t going to spend trillions of dollars on fighting a losing battle in the currency wars, they are simply waiting for the right time for this to happen. Don’t be caught off-guard.
Environmental sentences to ponder
Our empirical subjects are public and private entities’ compliance with the U.S. Clean Air Act and Safe Drinking Water Act. We find that, compared with private firms, governments violate these laws significantly more frequently and are less likely to be penalized for violations.
That is from Konisky and Teodoro, via Robin Hanson.
How big is Busan really?
Giacomo Ponzetto emails me:
I’m glad you found our recent working paper on urban networks interesting and cited it on Marginal Revolution. I’m also glad that your readers pointed out our lack of clarity concerning Busan.
As they have already noted, what we meant is that the metropolitan city of Busan would be the second largest city in the European Union by population within administrative city limits, after Greater London (8.5 million) and pretty much tied with the city-state of Berlin at 3.5 million (the latest official figures we could find are 3,563,578 for Busan in 2013 and 3,562,166 for Berlin on 31 December 2014). We find this an interesting fact. It reflects political and administrative decisions to facilitate urban integration in Asia and conversely to preserve local identities in Europe. On the other hand, we agree that administrative boundaries often don’t provide the most useful definition of a city. The problem is that no other definition is unambiguous and plainly comparable across countries.
In its 2006 Territorial Review Competitive Cities in the Global Economy, the OECD defined the Busan metro area to include the administrative units of Busan, Ulsan, and Gyeonsangnam-do. By this definition, greater Busan has around 8 million residents, which is also the figure reported by Wikipedia, without defining the metro area. As the OECD noted, this is probably an overstatement because Gyeongsangnam-do is a large province including non-urban districts. Yet, a much smaller Busan-Ulsan-Changwon metro area (including Gimhae, Yangsan, Miryang and Geoje) has around 7 million residents. It would be the third largest in the European Union, behind London and Paris (12 million residents in the functional urban area as defined by Eurostat) but ahead of Madrid (6.5 million).
However, if instead one takes the view that Busan, Ulsan and Changwon are three continguous metro areas instead of a single one, then Busan-Gimhae-Yangan would have only around 4.5 million residents. It would be smaller than Madrid, the Ruhr, Berlin and Barcelona, but at the top of the pack that includes Rome, Milan and Athens. We chose to rely on the administrative-city figures to avoid having to adjudicate which is the most accurate functional definition of Busan’s metro area. Either way, you’re right it’s all too easy to underestimate Busan.
The poor rely on fast food the least
New data, released by the Centers for Disease Control, show that America’s love for fast food is surprisingly income blind. Well-off kids, poor kids, and all those in between tend to get about the same percentage of their calories from fast food, according to a survey of more than 5,000 people. More precisely, though, it’s the poorest kids that tend to get the smallest share of their daily energy intake from Big Macs, Whoppers, Chicken McNuggets, and french fries.
That is from Robert Ferdman. By the way:
More than a third of all children and adolescents living in the country still eat some form of fast food on any given day, a number which hasn’t budged in decades, according to the CDC.
And many children are getting alarmingly high proportions of their diet from chicken nuggets and french fries. About a quarter of all kids in the United States get 25 percent of their calories from fast food. And 12 percent of kids get more than 40 percent of their calories from fast food.
South Korea (Europe) fact (?) of the day
Busan — the second largest city in South Korea — would also be the second largest city in Western Europe.
That is from the new and interesting paper by Glaeser, Ponzetto, and Zou (pdf), on mega-cities vs. networks. By the way, I consider Busan to be a lovely and underrated city, think of it as the Vancouver of Korea, and on a clear day you can look across the water and see Japan.
Update: See the comments for some challenges to the #2 claim.
Democratic elites don’t seem to care much about equality (sentences to ponder)
Yes, the set up is important, but let’s cut to the chase:
The experimental behaviors of these three subject classes—once again, making real allocations with real money—revealed stark differences between attitudes toward economic justice among ordinary Americans and among the elite. To begin with, the Berkeley and Yale subjects were twice as likely to be selfish as their compatriots in general. In this respect, intermediate and extreme elites stand together with each other, and stand apart from the rest of the country.
What’s more, elite Americans show a far greater commitment to efficiency over equality than ordinary Americans. And this time, the bias toward efficiency increases with each increment of eliteness. The ALP subjects split roughly evenly between focusing on efficiency and focusing on equality; the Berkeley students favored efficiency over equality by a factor of roughly 3-to-2; and the Yale Law students favored efficiency by a factor of 4-to-1.
Yale Law students’ overwhelming, indeed almost eccentric, commitment to efficiency over equality is all the more astonishing given that the students self-identified as Democrats rather than Republicans—and thus sided with the party that claims to represent economic equality in partisan politics—by a factor of more than 10-to-1. An elite constituted by highly partisan Democrats thus showed an immensely greater commitment to efficiency over equality than the bipartisan population at large.
That is from Ray Fisman and Daniel Markowits, do read the whole thing. I say that is mostly good news, and I disagree with the claim of the authors that a new class war is on its way.
Bloomberg’s take on Chinese data problems
You can read it here (pdf), via Tom Orlik, here is the excerpt which most strongly confirms my prior point of view:
The Caixin services PMI is barely in expansionary territory. A new index of restaurant revenue from Union-Pay Advisors contracted 7.9 percent year on year in August – a drop that reflects more than belt tightening by bureaucrats.
I should note that the overall stance of the piece is more nuanced than that single excerpt would indicate.
Jeremy Corbyn on Twitter
Thanks Hugo Chavez for showing that the poor matter and wealth can be shared. He made massive contributions to Venezuela & a very wide world
link here, from 2013, and
I believe that homeo-meds works for some ppl and that it compliments ‘convential’ meds. they both come from organic matter…
link here, from 2010. The spelling and grammar could be improved, too.
The pointers are from Marc Andreessen.
Ten years after enrollment
At Bennington College in Vermont, over 48 percent of former students were earning less than $25,000 per year. A quarter were earning less than $10,600 per year. At Bard College in Annandale-on-Hudson, the median annual earnings were only $35,700. Results at the University of New Mexico were almost exactly the same.
There is more here from Kevin Carey. There is the well-known debate between human capital and signaling theories, but sometimes education is neither…
Brazil vs. Australia, model this
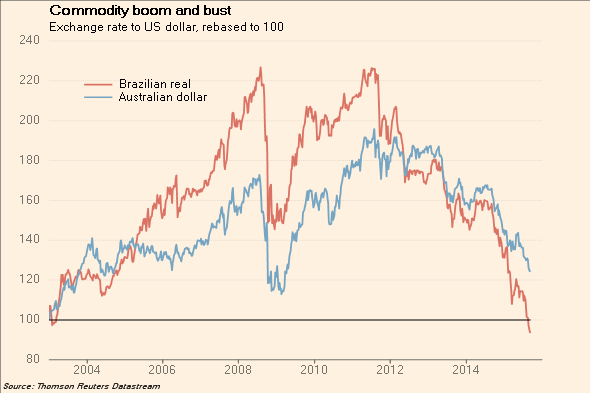
James Mackintosh has more to say.