Category: Data Source
Facts about automakers
Yermack estimates that the aggregate capital investment in GM and Ford since 1980 has led to a net reduction in capital of $465 billion…This is what I find particularly disturbing: with that $465 billion, “GM and Ford could have closed their own facilities and acquired all of the shares of Honda, Toyota, Nissan, and Volkswagen.”
Here is more. And here are facts about GM wages.
Where has all the income gone?
-
The U.S. Census Bureau reports that median household
income stagnated from 1976 to 2006, growing by only 18 percent. In
contrast, data from the Bureau of Economic Analysis indicate that
income per person was up 80 percent. -
Three data issues adversely impact reported median household income gains: the choice of price index, a change in the mix of household types and the measure of income used.
-
After adjusting the Census data for these three issues, inflation-adjusted median household income for most household types is seen to have increased by 44 percent to 62 percent from 1976 to 2006.
That’s from Terry Fitzgerald at the Minneapolis Fed. I am not sure if he is asserting that his alternatives measures are just that — alternative measures — or if they are the true and correct measures in the sense of being better than the alternatives. In any case this is the latest look at a long-contentious issue. I thank Don Boudreaux for the pointer.
China fact of the day
Electrical power generated in October is 4% below a year earlier.
Is there any chance that this is more reliable information than the gdp statistics offered up by the Chinese government?
The word of the year
That’s from Oxford. Runners-up were moofer and topless meeting.
The first two sound British to me and all three sound silly. I would have picked "Tweet."
The ten most irritating phrases?
Here is one list:
The top ten most irritating phrases:
1 – At the end of the day
2 – Fairly unique
3 – I personally
4 – At this moment in time
5 – With all due respect
6 – Absolutely
7 – It’s a nightmare
8 – Shouldn’t of
9 – 24/7
10 – It’s not rocket science
I thank Yang He for the pointer. At the end of the day, what would you add to this fairly unique list? With all due respect, I personally, at this moment in time, absolutely shouldn’t of suggested that it’s not rocket science because 24/7 people are saying this and it is literally a nightmare.
China market of the day
From a loyal MR reader:
I just read that there is a company in China hiring young females who are paid to get pregnant and deliever a baby for couples suffering from infertility.The interesting thing is the price discrimination. There are eight types of females with different "qualities".Example: Females who are middle school graduates and are not very pretty receive 40,000 RMB.Females who have bachelor’s degree and are pretty receive 100,000 RMB.
Unemployment During the Great Depression
Regarding unemployment during the Great Depression, Andrew Wilson writing at the WSJ recently said:
As late as 1938, after almost a decade of governmental “pump priming,” almost one out of five workers remained unemployed.
 Historian Eric Rauchway says this is a lie, a lie spread by conservatives to besmirch the sainted FDR. Nonsense. In 1938 the unemployment rate was 19.1%, i.e. almost one out of five workers was unemployed, this is from the official Bureau of Census/Bureau of Labor Statistics data series for the 1930s. You can find the series in Historical Statistics of the United States here (big PDF) or here. The graph is at right. Rauchway knows this but wants to measure unemployment using an alternative series which shows a lower unemployment rate in 1938 (12.5%). Nothing wrong with that but there’s no reason to call people who use the official series liars.
So why are there multiple series on unemployment for the 1930s? The reason is that the current sampling method of estimation was not developed until 1940, thus unemployment rates prior to this time have to be estimated and this leads to some judgment calls. The primary judgment call is what do about people on work relief. The official series counts these people as unemployed.
Rauchway thinks that counting people on work-relief as unemployed is a right-wing plot. If so, it is a right-wing plot that exists to this day because people who are on workfare, the modern version of work relief, are also counted as unemployed. Now if Rauchway wants to lower all estimates of unemployment, including those under say George W. Bush, then at least that would be even-handed but lowering unemployment rates just under the Presidents you like hardly seems like fair play.
Moreover, it’s quite reasonable to count people on work-relief as unemployed. Notice that if we counted people on work-relief as employed then eliminating unemployment would be very easy – just require everyone on any kind of unemployment relief to lick stamps. Of course if we made this change, politicians would immediately conspire to hide as much unemployment as possible behind the fig leaf of workfare/work-relief.
There is a second reason we may not want to count people on work-relief as employed and that is if we are interested in the effect of the New Deal on the private economy. In other words, did the fiscal stimulus work to restore the economy and get people back to work? Well, we can’t answer that question using unemployment statistics if we count people on work-relief as employed. Notice that this was precisely the context of the WSJ quote.
One final thing that one could do is count people on work-relief as neither employed nor unemployed, i.e. not part of the labor force which is what we do for people in the military. Rauchway has data on this and it shows almost the same thing, nearly one in five unemployed, as the original series. (In this case, however, Rauchway counts nearly one in five unemployed as a win for the New Deal because the same series also shows higher unemployment earlier in the Great Depression.)
Any way you slice it there is no right-wing plot to raise unemployment rates during the New Deal and a historian should not go around calling people liars just because their judgment offends his wish-conclusions.
Hat tip to Mark Thoma.
Betting markets in everything
Right now the odds are running 4-1.
I thank Chris F. Masse for the pointer.
Speaking of markets and empirical verification, here is $300 million for the University of Chicago Business School.
And here is how markets clear in Nigeria.
The iPod Nano index
You’ll find it here. It seems that Australia has the cheapest iPod, followed by Indonesia and Canada. Argentina has the most expensive iPod, even though it is generally a very cheap country. These figures are listed as from October 2008, but I wonder if Iceland still has the sixth most expensive iPod Nano?
I thank John De Palma for the pointer.
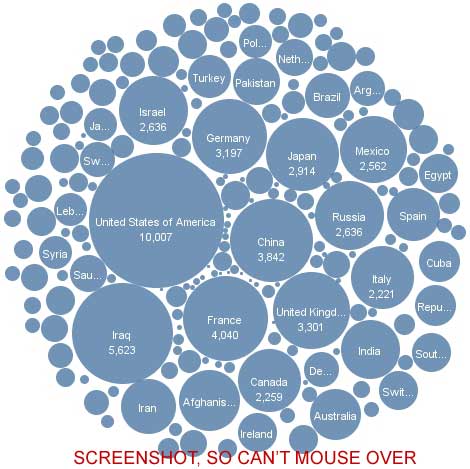
Which countries does the NYT cover?

Here is further discussion, noting that I am a little confused about how the U.S. is counted and why it doesn’t appear more often.
Hungary fact of the day
…85 percent of household lending was denominated in foreign currencies last year.
Here is the article, entitled "Swiss franc mortgages lose their appeal."
Economics Videos from Marketplace
Paddy Hirsch the senior editor at American Public Media’s Marketplace radio program has produced a number of delightful videos on economic matters. The videos are witty, accessible but also well-informed – ideal for a senior high school or undergrad class and also a great place to crib notes if you want to explain to people what is going on when they ask you at parties (Yes, this does happen to me but admittedly I may go to different parties than you.) Here are a few of my favorites.
- The credit crisis as Antarctic expedition
- Getting naked in short selling
- Untangling credit default swaps
Thanks to Robby Thompson for the link.
What does a credit crunch look like?
Maybe Alex is tired of this topic, if so I apologize. But Isaac Sorkin sent me notice of this:
What does a global credit crunch look like when it comes down to raw numbers? A 3% quarterly decline in international banking activity. It doesn’t sound like much, but it represents $1.1 trillion–and that was just a snapshot taken at the end of June, before the Lehman Bros. collapse worsened the crisis in interbank lending.
It is also three times bigger than the largest contractions of the past three decades–as long as such records have been kept. After the demise of hedge fund Long-Term Capital Management in 1998, international banking activity fell by 1.2% in the fourth quarter of that year. After the dot-com bubble burst, the contraction was 1%, or $125 billion–chump change compared with today’s banking volumes.
The numbers come from the provisional international banking statistics for the second quarter of this year, released Thursday by the Bank for International Settlements, the Basel, Switzerland-based organization that acts as a lender for central banks. BIS says most of the decline was accounted for by "short-term interbank credits in U.S. dollars," i.e., banks not lending to each other overnight–the logjam…we have heard so much about being at the heart of the credit crunch.
Note that is only from the second quarter; we’ll see what the third quarter statistics look like. Here is the BIS link. Note that second quarter lending was as robust as it was in part because of continued lending from Europe to Eastern Europe and also to Iceland. That’s more reason to worry, not less.
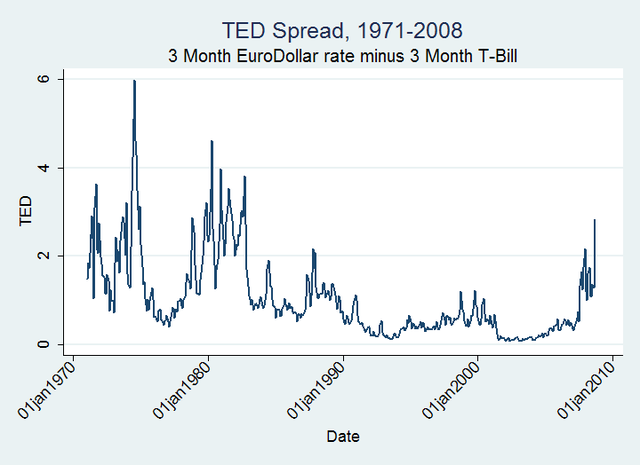
The Long Term Perspective on the TED Spread
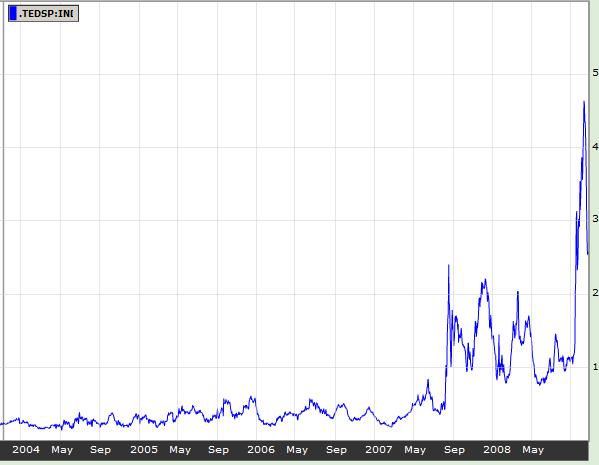
Here is the usual picture of the TED spread from Bloomberg.
I was curious to see a longer-term picture so I collected data on the 3 month Treasury bill rate (TB3MS from the St. Louis Fed.) and the 3-month Eurodollar rate (EDM3 from the Fed.) Note that this is current up to September. Also this is slightly different from calculations elsewhere because it’s on a monthly basis, so some daily jumps are smoothed out, and sometimes a different LIBOR rate seems to be used for the ED rate but the different versions appear to correlate well. The advantage of using these measures is that you can get a much longer time series. Here it is (click to expand if unclear).
Godwit fact of the day
The bar-tailed godwit, a plump shorebird with a recurved bill, has
blown the record for nonstop, muscle-powered flight right out of the
sky.A study being published today reports that godwits can fly as many
as 7,242 miles without stopping in their annual fall migration from
Alaska to New Zealand. The previous record, set by eastern curlews, was
a 4,000-mile trip from eastern Australia to China.The birds flew for five to nine days without rest, a few landing on
South Pacific islands before resuming their trips, which were monitored
by satellite in 2006 and 2007.
Here is the full story.