Category: Data Source
The economics of Lego (investment markets in everything)
Here is one excerpt from a lengthy and data-intensive post, which likely offers more than you ever would wish to know:
The internet can be blamed for the size and scope of the secondary LEGO market. On the website, BrickLink, you can find almost any set that LEGO has ever produced. In addition, the site keeps records of trends in the market and value of individual pieces. This site is invaluable to a LEGO collector and has given many the ability to grow their collections. Before the advent of this site and sites like eBay, collecting LEGO required going to garage sales. There are now whole sites dedicated to buying LEGO as an investment, but that is a topic for another article.
This creation and expansion of the secondary market in conjunction with LEGO now marketing some of their products to an older audience has made the prices of some old sets increase exponentially. On the extreme range, there is the UCS Millennium Falcon that is selling new for upwards of $2,000 (and close to $1,500 USED!). It sold for $500 new in 2007. Even non-licensed sets can run a premium, such as the Cafe Corner that was one of the original modular buildings. It was $150 new and now it can sell for over $1,000.
For pointers I thank Michael Rosenwald and Kevin Won.
Average earnings of young college graduates are still falling
Alas, take a look:
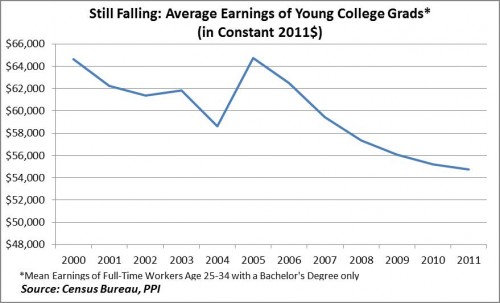
Diana G. Carew, who works with Michael Mandel, reports:
The latest Census figures show real earnings for young college grads fell again in 2011. This makes the sixth straight year of declining real earnings for young college grads, defined as full-time workers aged 25-34 with a bachelor’s only. All told, real average earnings for young grads have fallen by over 15% since 2000, or by about $10,000 in constant 2011 dollars.
That picture is the single biggest reason why higher education in this country is in economic trouble as a sector. And yes, I do understand that the “education premium” is robust, but that means wages for non-college workers have been hurting as well. At some margin, when it comes to determining how much you will pay for college, the absolute return matters too. The full article is here.
Can prices be sticky if they change all the time?
Emi Nakamura and Jon Steinsson ask exactly that question:
Figure 2 plots a typical price series for a grocery product in the United States. This figure illustrates a central issue in thinking about price rigidity for consumer prices: Does this product have an essentially flexible price, or is its price highly rigid? On the one hand, the posted price for this product changes quite frequently. There are 117 changes in the posted price in 365 weeks. The posted price thus changes on average more than once a month. On the other hand, there are only 9 regular price changes over a roughly 7 year period. Which of these summary measures of price rigidity is more informative?
Here is their new paper (pdf), which is an excellent survey of what we know about price (as opposed to wage) stickiness.
You will note is that we know more about price stickiness in times of inflation rather than deflation, if only because we have more of the former. Intuitively, one might expect greater flexibility of prices in the downward direction, for prices that is. Why are bosses afraid to cut nominal wages? It will disrupt worker morale and prompt shirking and sabotage. Why might suppliers be reluctant to raise prices? They might not wish to upset long-term relationships and expectations with customers. But customers would love nominal price declines, or so it would seem.
Less-than-fully-flexible nominal prices may follow from sticky nominal wages, to be sure. But absolutely sticky nominal prices? The supplier still can cut price by a bit. By construction of the problem, these are sectors which are not perfectly competitive and thus we are not at P = MC. If demand goes down, and one of your main costs is sticky, you still can shade price a bit rather than say raising it. Since “menu costs” appear refuted by the data, small price changes should not be so costly.
Yet, in reality, we don’t actually know much about what happens and why.
From the estimable Chug
In The Economist’s Pocket World in Figures, 2013 Edition, in which category/table does the United States rank between North Korea and Greece?
Least trade dependent as % of GDP, 2010
NK 9.3%
US 11.7%
Greece 13.2%Bermuda is #1 at 9.2%
Page 32
Chug
Bermuda!?
Is it because of the heavy weight of their International Business Centre? I do not know.
Selling Federal Assets
According to The Institute for Energy Research the Federal government owns oil and gas worth on the order of $128 trillion. I suspect that these numbers are optimistic. Nevertheless, some judicious sales of land and assets (and to its credit the Obama administration has made some small steps in this direction) would be wise.
Federal assets below the ground are primarily mineral and energy resources, such as oil, natural gas, and coal. For example, the United States owns millions of acres and billions of barrels of oil that can be developed on federal lands and waters. Currently, the government leases only 2 percent of federal offshore areas and less than 6 percent of federal onshore lands for oil and natural gas production. Areas that the federal government could open to oil and gas development include:
- The 10.4 billion barrels of oil and 8.6 trillion cubic feet of natural gas in the Arctic National Wildlife Refuge
- The 86 billion barrels of oil and 420 trillion cubic feet of natural gas in the outer continental shelf of the lower 48 states
- The 896 million barrels of oil and 53 trillion cubic feet of natural gas in the Naval Petroleum Reserve-Alaska
- The 25 billion barrels of oil in the outer continental shelf of Alaska
- The 90 billion barrels of oil and 1,669 trillion cubic feet of natural gas in the geologic provinces north of the Arctic circle
- The 982 billion barrels of oil shale in the Green River Formation in Colorado, Utah, and Wyoming.
These technically recoverable resources total 1,194 billion barrels of oil and 2,150 trillion cubic feet of natural gas that is owned by the federal taxpayer. At $100.00 per barrel of oil and $4.00 per thousand cubic feet of natural gas, the oil resources are worth $119.4 trillion and the natural gas resources are worth $8.6 trillion for a grand total of $128 trillion, or about 8 times the U.S. national debt.[iii]
Hat tip: Robert Murphy.
What is driving growth in government spending?
Here are some very useful pictures and infographics, excerpt:
To clarify: all of the major categories of government spending have been increasing relative to inflation. But essentially all of the increase in spending relative to economic growth, and the potential tax base, has come from entitlement programs, and about half of that has come from health care entitlements specifically.
That is not NRO but rather Nate Silver. Here is the concluding tag:
We may have gone from conceiving of government as an entity that builds roads, dams and airports, provides shared services like schooling, policing and national parks, and wages wars, into the world’s largest insurance broker.
Most of us don’t much care for our insurance broker.
For the pointer I thank Rob Raffety.
Addendum: Henry Aaron has a very sane piece on progressives and the safety net. I see the current American Left as rapidly losing what it once knew about the need for entitlement reform. This is a shame, it does not augur well for our fiscal future, and it remains an under-reported story. I see it happening right under my nose, day by day, article by article, blog post by blog post.
What do Data Scientists Do?
Andrew Gelman edits The Statistics Forum, a blog of the American Statistical Association. He is looking for a series of guest posts about what statisticians/econometricians/data scientist do during their day–not the theory but the nitty gritty of what a typical day with its frustrations and triumphs looks like. Kaiser Fung’s post, three hours in the life of a (glorified) “data scientist” could be a model. Submissions from stats people in any field, academia, business, non-profit etc. are all welcome. Write Andrew here.
Facts about cities
The average tract density of all these (U.S.) cities taken together declined in every decade since 1910, from 69.6 persons per hectare in 1910 to 14.6 persons per hectare in 2000, almost a fivefold decline. Fitting an exponential curve to this average density in every decade from 1910 to 2000, we found that the average annual rate of decline for the entire period, assuming a constant rate, was 1.92 percent. Declines in average tract density between any two consecutive censuses were registered in 124 of the 153 observations, or 81 percent of the time.
That is from the new and quite interesting Planet of Cities, by Shlomo Angel. My takeaway is that the Avent-Yglesias push for greater urban density, which I sympathize with, is unlikely to happen on a significant scale. If you are looking for hopeful signs, there is this:
…between 1990 and 2000, six cities in this group registered an increase in average tract density: New York, Washington, Los Angeles, St. Paul, Syracuse, and Nashville. Hence, while average densities in U.S. cities have been in general decline for almost a century, they may now be reaching a plateau and even gradually increasing.
I definitely recommend this book to all those with an interest in urban issues.
The Prison Population is Down

After more than thirty years of constant increase, prison populations have leveled off and in the last few years have begun to decline (pdf). It’s a momentous change and Keith Humphreys argues that the story has been under-reported because few people want to play up the good news
(1) Most of the state, local and federal officials who have helped reduce incarceration are scared to publicly take credit for it. In general, reducing incarceration is a good thing, but probability dictates that in particular cases it will be a horrible thing. At least a few of the roughly 100,000 fewer people under correctional supervision in 2011 versus 2010 for example will do something extremely violent and high-profile, and no politician wants to risk being in a story headlined “Convict released by thug-loving governor murders nun”.
Hat tip: Matt Yglesias.
How much might marginal tax rates be going up?
Gerald T. Prante and Austin John have a new paper and a report for us:
This paper compares state-by-state estimates of the top marginal effective tax rates (METRs) on wages, interest, dividends, capital gains, and business income for tax year 2012 to the rates scheduled for 2013 under scheduled law. Scheduled tax law for 2013 assumes the expiration of the 2001 and 2003 tax cuts and the new PPACA taxes. Overall, the average top METR on wage income is scheduled to increase by approximately six percentage points (41.8 percent to 47.8 perent), while taxes on dividends would increase the greatest (19.0 percent to 47.9 percent). The top METRs on wages, dividends, interest, and partnership/sole proprietor income would exceed 50 percent in California, Hawaii, and New York City.
“Soviet Power Plus Electrification: what is the long-run legacy of communism?”
That is a newly published paper by Wendy Carlin, Mark Schaffer, and Paul Seabright, and here is the abstract:
Two decades after the end of central planning, we investigate the extent to which the advantages bequeathed by planning in terms of high investment in physical infrastructure and human capital compensated for the costs in allocative inefficiency and weak incentives for innovation. We assemble and analyse three separate types of evidence. First, we find that countries that were initially relatively poor prior to planning benefited more, as measured by long-run GDP per capita levels, from infrastructure and human capital than they suffered from weak market incentives. For initially relatively rich countries the opposite is true. Second, using various measures of physical stocks of infrastructure and human capital we show that at the end of planning, formerly planned countries had substantially different endowments from their contemporaneous market economy counterparts. However, these differences were much more important for poor than for rich countries. Finally, we use firm-level data to measure the cost of a wide range of constraints on firm performance, and we show that after more than a decade of transition in 2002-05, poor ex-planned economies differ much more from their market counterparts, in respect to both good and bad aspects of the planning legacy, than do relatively rich ones. However, the persistent beneficial legacy effects disappeared under the pressure of strong growth in the formerly planned economies in the run-up to the global financial crisis.
This paper is a very good place to start for trying to seriously figure out what communism did and did not do. It accounts for the relatively disastrous performance of East relative to West Germany, while helping to explain why Russia is in some regards a better place to live than Mexico. It is also a very strong testament to the extreme importance of human capital and good formal education.
They also cite a recent Broadberry and Klein piece, “When and Why did Eastern European Economies Begin to Fail?, Lessons from a Czechoslovak/UK Productivity Comparison, 1921-1991,” available in an earlier form here (pdf); in this case I worry more about the quality of the statistics, plus legacy effects can sustain a formerly successful economy for some while.
Why is there Corn in Your Coke?
A good one on the sugar quota.
Just how bad is corruption in China?
In a new paper, my colleague Carlos Ramirez has the scoop:
Abstract:
This paper compares corruption in China over the past 15 years with corruption in the U.S. between 1870 and 1930, periods that are roughly comparable in terms of real income per capita. Corruption indicators for both countries and both periods are constructed by tracking corruption news in prominent U.S. newspapers. Several robustness checks confirm the reliability of the constructed corruption indices for both countries. The comparison indicates that corruption in the U.S. in the early 1870s — when it’s real income per capita was about $2,800 (in 2005 dollars) — was 7 to 9 times higher than China’s corruption level in 1996, the corresponding year in terms of income per capita. By the time the U.S. reached $7,500 in 1928 — approximately equivalent to China’s real income per capita in 2009 — corruption was similar in both countries. The findings imply that, while corruption in China is an issue that merits attention, it is not at alarmingly high levels, compared to the U.S. historical experience. The paper further argues that the corruption and development experiences of both the U.S. and China appear to be consistent with the “life-cycle” theory of corruption — rising at the early stages of development, and declining after modernization has taken place. Hence, as China continues its development process, corruption will likely decline.
Sentences to ponder
This first figure shows that aggregate demand growth has not been affected by a tightening of fiscal policy since 2010. Specifically, it shows that nominal GDP (NGDP) growth has been remarkably stable since about mid-2010 despite a contraction in federal government expenditures.

That is from Macro and Other Market Musings, and there is another good picture at the link. I understand full well that this is “unadjusted” and one may well argue “growth could have been stronger.” I’ll simply note that I’d like to see discussions of fiscal policy accompanied by this picture as a starting point for analysis.
I would not, by the way, endorse the author’s conclusion about crashing into the fiscal cliff;; for one thing uncertainty and sectoral effects would be significant and would interact negatively with AD effects, even under perfect Fed policy.
For the pointer I thank David Levey.
The truly important news
Forget post-election dissection and the fiscal cliff, here is the stunner:
The U.S. birthrate plunged last year to a record low, with the decline being led by immigrant women hit hard by the recession, according to a study released Thursday by the Pew Research Center.
The overall birthrate decreased by 8 percent between 2007 and 2010, with a much bigger drop of 14 percent among foreign-born women. The overall birthrate is at its lowest since 1920, the earliest year with reliable records. The 2011 figures don’t have breakdowns for immigrants yet, but the preliminary findings indicate that they will follow the same trend.
That’s the real fiscal cliff. Yet The Washington Post reports that its most popular article today is “Starbucks’ new $7 coffee is its priciest ever.“