Category: Data Source
Labor Day
Thanks capitalism!
The Dominican Republic is underrated
Despite being one of Latin America’s poorest countries in the mid-1960s, the Dominican Republic has made remarkable progress in terms of income convergence…
What is remarkable about the Dominican Republic’s progress is not just the level of convergence but also its speed compared to other countries in the region. By examining the average convergence velocity, or the rate of change in income convergence per decade, it is evident that the Dominican Republic has exhibited the highest average convergence velocity, or “blue shift,” in Latin America over the past 50 years. Panama and Chile have achieved equally meaningful but still lower positive convergence velocities, while the majority of countries in the region have experienced either very low (“green shift”) or negative (“red shift”) convergence velocities.
Here is the full IMF brief, retweeted by Matt Yglesias. There is much more at the link. I have been there twice, including as recently as last year (albeit briefly), and this accords with my intuitions.
Who Runs the AEA?
That is a new JEL publication (gated) by Kevin D. Hoover and Andrej Svorenčík, here is the abstract:
The leadership structure of the American Economic Association is documented using a biographical database covering every officer and losing candidate for AEA offices from 1950 to 2019. The analysis focuses on institutional affiliations by education and employment. The structure is strongly hierarchical. A few institutions dominate the leadership, and their dominance has become markedly stronger over time. Broadly two types of explanations are explored: that institutional dominance is based on academic merit or that it is based on self-perpetuating privilege. Network effects that might explain the dynamic of increasing concentration are also investigated.
And this:
The current paper is based on an extensive prosopographical database covering the entire leadership of the AEA over the
1950–2019 period, including all Presidents, Presidents-elect, Vice Presidents, ordinary members of the Executive Committee, as well as the losing candidates for all elective offices, and members of the Nominating Committee.
The results?:
The 14 institutions in the table account for almost more than 80 percent of the positions for the whole 1950–2019 period. Even within this select group, the distribution is highly skewed with Harvard, the top supplying institution over the period accounting for more than a fifth of the total, and the last five universities accounting for around 2 percent each. The top five institutions, Harvard, MIT, Chicago, Columbia, and Stanford, which we designate as the first tier, account for over half (57.1 percent) of the positions over the whole period…
The authors summarize their findings:
The most obvious lessons are, perhaps, hardly surprising: the AEA leadership is overwhelmingly drawn from a small group of elite, private research universities—in the sense that its leaders were educated at these universities and, to a lesser degree, employed by them. What is less well-known is that for much of the past 70 years, the AEA leadership has been drawn predominantly from just three universities—Harvard, MIT, and Chicago.
By the way, institutional concentration has become more pronounced over time, not less. But since about eighty percent of U.S. students go to state schools, most of those large state schools, I guess we can reconfigure all these panels to have eighty percent state school representation, rather than 80 percent elite school representation. Right? Right?
You may or may not like these facts (I for one am willing to admit to more elitism than are many people), for the time being I will say only this: “Do not listen to what they say, watch what they do!”
South Appalachia > North Appalachia
The ARC classifies 27.2 percent of North Appalachian counties as distressed but only 9.6 percent of South Appalachian counties that way. Over 70 percent of counties in South Appalachia have grown in population since the 2020 Census. North Appalachia lost 17,131 people in total, while South Appalachia gained 127,585. The difference in net in-migration is even more stark. While the North posted positive net domestic in-migration of 22,563, the South tallied almost 300,000—13 times as high. The story is similar for jobs, with the North losing 227,049 positions since the pre-pandemic year of 2019, while the South actually exceeded its pre-Covid levels by 66,377. In other words, much of South Appalachia is seeing a population inflow and is growing in both population and employment.
Here is much more from Aaron M. Renn, of interest and with good maps, and for the pointer I thank Terry O’Connor.
The Relentless Rise of Stablecoins
1. In 2022, stablecoins settled over $11tn onchain, dwarfing the volumes processed by PayPal ($1.4tn), almost surpassing the payment volume of Visa ($11.6tn), and reaching 14% of the volume settled by ACH and over 1% the volume settled by Fedwire. It is remarkable that in just a few years, a new global money movement rail can be compared with some of the world’s largest and most important payment systems.
2. Over 25mm blockchain addresses hold over $1 in stablecoins. Of these, ~80%, or close to 20mm addresses, hold between $1 and $100. For a sense of scale, a US bank with 25mm accounts would rank as the 5th largest bank in the US by number of accounts. The massive number of small-dollar stablecoin holdings indicates the potential for stablecoins to provide global financial services to customers underserved by traditional financial institutions.
3. Approximately 5mm blockchain addresses send stablecoins each week. This number provides a very rough proxy for global users regularly interacting with stablecoins. These ~5mm weekly active addresses send ~38mm stablecoin transactions each week, representing an average of over 7 weekly transactions per active address.
4. Stablecoin usage has decoupled from crypto exchange volumes, indicating that significant stablecoin transaction volumes may be driven by non-trading/speculative activity. Since December 2021, centralized exchange volumes are down 64%, and decentralized exchange volumes are down 60%. During this period, stablecoin volumes are down only 11%, and weekly active stablecoin addresses and weekly stablecoin transactions are up over 25%.
5. Of the ~5mm weekly active stablecoin addresses, ~75% transact less than $1k per week, indicating that small/retail users likely represent the majority of stablecoin users.
6. The outstanding supply of stablecoins has grown from less than $3bn five years ago to over $125bn today (after peaking at over $160bn) and has shown resilience to the market downturn with the market cap of stablecoins currently down ~24% from its peak, compared with a ~57% decline for the overall crypto market cap.
7. Less than 1/3rd of stablecoins are held on exchanges. Most are held in externally owned accounts (not exchanges or smart contracts).
8. The majority of stablecoin activity uses Tether (USDT). Tether represents 69% of stablecoin supply, and YTD has accounted for 80% of weekly active addresses, 75% of transactions, and 55% of volumes.
9. Most stablecoin activity occurs on the Tron and BSC blockchains. Year-to-date, the Tron and BSC blockchains collectively account for 77% of weekly active addresses, 75% of transactions, and 41% of volumes.
10. The Ethereum blockchain is used for higher value transactions (on average). Despite accounting for just 6% of active wallets and 3% of transactions, the Ethereum blockchain is home to 55% of stablecoin supply and settles close to 50% of weekly stablecoin $ volume.
These are all from a Bevan Howard report, The Relentless Rise of Stablecoins (requires email).
The geography of Indian grandmasters
The chart speaks for itself. pic.twitter.com/35erte95c6
— 𑀅𑀫𑀦 (@The_Equationist) August 28, 2023
Via Scott Sumner.
Market Response to Racial Uprisings
Defund the police was never really in the cards:
Do investors anticipate that demands for racial equity will impact companies? We explore this question in the context of the Black Lives Matter (BLM) movement—the largest racially motivated protest movement in U.S. history—and its effect on the U.S. policing industry using a novel dataset on publicly traded firms contracting with the police. It is unclear whether the BLM uprisings were likely to increase or decrease market valuations of firms contracting heavily with police because of the increased interest in reforming the police, fears over rising crime, and pushes to “defund the police”. We find, in contrast to the predictions of economics experts we surveyed, that in the three weeks following incidents triggering BLM uprisings, policing firms experienced a stock price increase of seven percentage points relative to the stock prices of nonpolicing firms in similar industries. In particular, firms producing surveillance technology and police accountability tools experienced higher returns following BLM activism–related events. Furthermore, policing firms’ fundamentals, such as sales, improved after the murder of George Floyd, suggesting that policing firms’ future performances bore out investors’ positive expectations following incidents triggering BLM uprisings. Our research shows how—despite BLM’s calls to reduce investment in policing and explore alternative public safety approaches—the financial market has translated high-profile violence against Black civilians and calls for systemic change into shareholder gains and additional revenues for police suppliers.
That is from a new NBER working paper by Bocar A. Ba, Roman Rivera, and Alexander Whitefield.
What’s Behind Her Smile? Health, Looks, and Self-Esteem
Looks matter!:
This paper examines how improving dental health affects economic, social, and psychological outcomes. In a randomized experiment, we provide a low-income group in Chile free dental care, including prostheses, and find significant and persistent impacts on men’s and women’s dental and self-perceived mental health. For women, treatment generates steady improvement in self-esteem, a higher likelihood of smiling when photographed, short-run improvements in employment and earnings, and improvement in partner interactions. We find no impact for men in any of these dimensions. Heterogeneity analyses suggest that treatment effects on labor market outcomes are larger for women with more severe visible dental issues at baseline. In summary, we find that increasing access to dental care, including cosmetic elements, improves important aspects of people’s lives.
That is from a forthcoming paper by Francisco A. Gallego, Cristian Larroulet Philippi, and Andrea Repetto. Via Maxwell G.
Excess All-Cause Mortality in China After Ending the Zero COVID Policy
In this cohort study across all regions in mainland China, an estimated 1.87 million excess deaths occurred among individuals 30 years and older during the first 2 months after the end of China’s zero COVID policy. Excess deaths predominantly occurred among older individuals and were observed across all provinces in mainland China, with the exception of Tibet.
So what is the proper sarcastic headline here? “I guess that flu was worse than we thought!”? Or “How is it that China ran out of ivermectin?” Here is the new JAMA piece, via Rich Dewey.
To be clear, I never thought Zero Covid was a sustainable policy for China. The real criminal negligence lies with CCP leadership, which turned down opportunities to pursue joint mRNA vaccine production — with the West of course — earlier on.
Which businesses mix the classes best?
Casual restaurant chains, like Olive Garden and Applebee’s, have the largest positive impact on cross-class encounters through both scale and their diversity of visitors. Dollar stores and local pharmacies like CVS deepen isolation. Among publicly-funded spaces, libraries and parks are more redistributive than museums and historical sites. And, despite prominent restrictions on chain stores in some large US cities, chains are more class diverse than independent stores. The mix of establishments in a neighborhood is strongly associated with cross-class Facebook friendships (Chetty et al., 2022).
That is from a new paper by Maxim Massenkoff and Nathan Wilmers. Via Scott Lincicome.
What makes for a good Royal Navy senior officer?
In most studies of talent, it is very difficult to get the top performers to respond or offer data. This paper is a major exception to that general limitation:
This paper assesses the impact of general intelligence, as well as specific personality traits, and aspects of motivation, on performance, potential, and advancement of senior leaders. A questionnaire survey was conducted on the full population of 381 senior officers in the Royal Navy with an 80% response rate. Performance, potential, and rate of advancement were established direct from the organization’s appraisal system; intelligence, personality traits and motivation were assessed, at the time of the study, using the Verify G+ Test, Occupational Personality Questionnaire, and Motivation Questionnaire. Findings suggest differences in motivation are more important than differences in general intelligence, or personality traits, in predicting assessed performance, potential within, and actual rate of advancement to, senior leadership positions. This is a rare example of a study into very senior leaders, validated against both formal appraisal data and actual rates of advancement. As a consequence of this study the Royal Navy has started to use psychometric-based assessments as part of the selection and development of its most Senior Officers.
Here is the full (gated) paper by Mike Young and Victor Dulewicz. I’ll pull out and repeat the key sentence there: “Findings suggest differences in motivation are more important than differences in general intelligence, or personality traits, in predicting assessed performance, potential within, and actual rate of advancement to, senior leadership positions.“
The Gender Death Gap
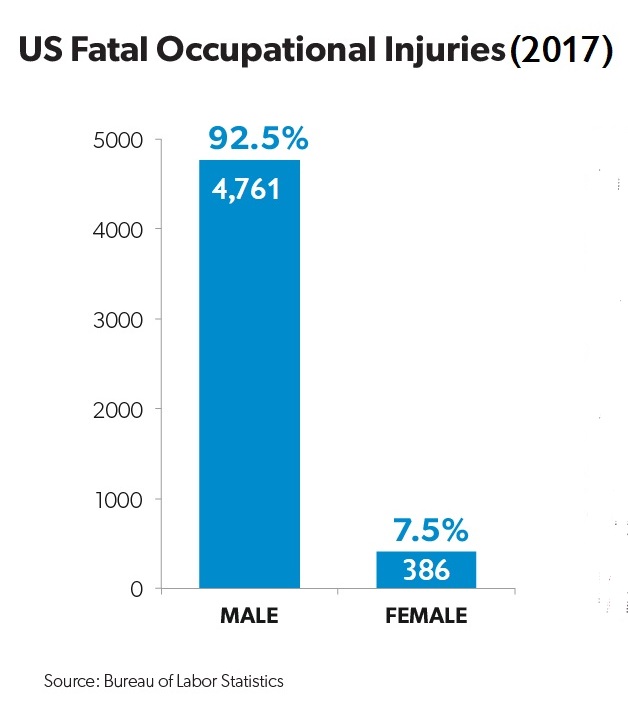 Hat tip: i/o.
The Impact of Vaccines and Behavior on U.S. Cumulative Deaths from COVID-19
It is hard to think of a topic area where the Republican Party, the right-wing, and (many by no means all) MR commentators are so far off base. Here are some new results from Andrew Atkeson:
…I find that vaccines saved 748,600 lives through June 2023. That is, without vaccines, cumulative mortality from COVID-19 would have been closer to 1.91 million over this time period. In answering the second question, I find that behavioral efforts to slow the transmission of the virus before vaccines became widely administered were critical to this positive impact of vaccines on cumulative mortality. For example, with a complete relaxation of these mitigation efforts, vaccines would have come too late to have saved a significant number of lives. Earlier deployment of vaccines would have saved many lives. I find that marginal changes in the strength of the behavioral response to COVID-19 deaths within the range of those responses estimated with the model have a significantly impact on cumulative COVID-19 mortality over this time period.
Here is the full paper. By the way, in case you are wondering I did write some columns arguing we should reopen the schools (and I strongly encouraged my own institution, GMU, to reopen in the fall of 2020, when asked for advice. Mercatus reopened once our landlord allowed us to.). But I am glad that for instance normal NBA games with full crowds were not up and running in the usual manner in November of 2020.
Dominican Republic fact of the day
The Dominican Republic 🇩🇴 is experiencing a remarkable convergence in per capita income with the US, outpacing all other Latin American countries. With the right policies, it has the potential to become an advanced economy within the next four decades. ➡️ https://t.co/s8ofH9u1B9 pic.twitter.com/wJ7MSy48k7
— IMF (@IMFNews) August 4, 2023
Sam Peltzman on American happiness
Sam is still writing good papers:
Since 1972 the General Social Survey (GSS) has asked a representative sample of US adults “… [are] you …very happy, pretty happy, or not too happy?” Overall, the population is reasonably happy even after a mild recent decline. I focus on differences along standard socio demographic dimensions: age, race, gender, education, marital status income and geography. I also explore political and social differences. Being married is the most important differentiator with a 30-percentage point happy-unhappy gap over the unmarried. Income is also important, but Easterlin’s (1974) paradox applies: the rich are much happier than the poor at any moment, but income growth doesn’t matter. Education and racial differences are also consequential, though the black-white gap has narrowed substantially. Geographic, gender and age differences have been relatively unimportant, though old-age unhappiness may be emerging. Conservatives are distinctly happier than liberals as are people who trust others or the Federal government. All above differences survive control for other differences.
Here is the SSRN link, via the excellent Kevin Lewis.