Category: Data Source
Mask Mandate Costs
There is now an NBER working paper on this topic:
This paper presents the results from a hypothetical set of questions related to mask-wearing behavior and opinions that were asked of a nationally representative sample of over 4,000 participants in early 2022. Mask mandates were hotly debated in public discourse, and though much research exists on benefits of masks, there has been no research thus far on the distribution of perceived costs of compliance. As is common in economic research that aims to assess the value to society of non-market activities, we use survey valuation methods and ask how much participants would be willing to pay to be exempted from rules of mandatory community masking. The survey asks specifically about a 3 month exemption. We find that the majority of respondents (56%) are not willing to pay to be exempted from mandatory masking. However, the average person was willing to pay $525, and a small segment of the population (0.9%) stated they were willing to pay over $5,000 to be exempted from the mandate. Younger respondents stated higher willingness to pay to avoid the mandate than older respondents. Combining our results with standard measures of the value of a statistical life, we estimate that a 3 month masking order was perceived as cost effective through willingness-to-pay questions only if at least 13,333 lives were saved by the policy.
That is by Patrick Carlin, Shyam Raman, Kosali I. Simon, Ryan Sullivan, and Coady Wing. A few comments:
1. Willingness to be paid magnitudes are often much higher than willingness to pay numbers. Especially when issues of justice and desert are involved. I know some people who might say: “I have a right to refuse a mask. I’m not going to pay anything not to wear one, but you would have to pay me a million dollars to put it on.” There are less extreme versions of this view, noting that even in quite normal laboratory circumstances WTBP can be 5x higher than WTP.
2. For many people the value of masking — either positively or negatively — depends on what others do. Some might feel “I guess I can wear a mask, but if you make everyone do that, that is a gross Orwellian dystopia.” Others, perhaps leaning more to the political left, might say: “I am willing to do my share, but of course I expect the same from everyone else. Let us sing this collective song and with our masks dance to the heavens!”
3. Why not just look at what private sector establishments chose when the force of law was not present? Don’t they have the best sense of how to internalize all the different factors behind what their customers want? Of course the answer here will vary, depending on what stage of the pandemic we are in.
U.S.A.-India fact of the day
US ambassador to India, Eric Garcetti, has emphasized the remarkable success of Indian immigrants in the United States, noting that over 10% of Fortune 500 companmy CEOs as Indian immigrants who studied in the US.
Here is the link. Via the excellent Samir Varma.
The world of labor shortages, the culture that is alcohol
Drunken-driving deaths in the U.S. have risen to levels not seen in nearly two decades, federal data show, a major setback to long-running road-safety efforts.
At the same time, arrests for driving under the influence have plummeted, as police grapple with challenges like hiring woes and heightened concern around traffic stops.
Here is more from the WSJ. “About 13,500 people died in alcohol-impairment crashes in 2022…” Here is my earlier post on the culture of guns and the cultural of alcohol.
Via the excellent Kevin Lewis.
Migrants at Sea: Unintended Consequences of Search and Rescue Operations
Many countries are facing and resisting strong migratory pressure, fueling irregular migration. In response to mounting deaths in the Central Mediterranean, European nations intensified rescue operations in 2013. We develop a model of irregular migration to identify the effects of these operations. We find that smugglers responded by sending boats in adverse weather and utilizing flimsy rafts, thus inducing more crossings in dangerous conditions and ultimately offsetting intended safety benefits due to moral hazard. Despite the increased risk, these operations likely increased aggregate migrant welfare; nevertheless, a more successful policy should instead restrict supply of rafts and expand legal alternatives.
That is by Claudio Deiana, Vikram Maheshri and Giovanni Mastrobuoni, published in the latest issue of the AEA policy journal.
As a side point, the call for greater legality is under-argued to say the least. This is a classic example of academic bias not being called out, as there is zero consideration of the costs of such migration. Loyal MR readers will know I am hardly unsympathetic to immigration, but there are reasons why the arrival of so many migrants in Europe is unpopular. Policy recommendations can be issued without considering those reasons? And there is a call for the EU to help Africa grow — are there plausible policy instruments there with benefits above costs? Enough to matter for the migration problem? Doesn’t making poor societies richer often boost the flow of migrants because now migration can be planned and afforded? Also not discussed.
Or maybe it is that no one thinks these are real policy discussions, rather it is not “mood affiliation permissible” to simply end a piece on the note that trying to help vulnerable individuals can backfire and lead to a lot of moral hazard? And so a mood affiliation of “we care about them nonetheless” has to be slipped in at the end?
Either way come on, both authors and editors…
Nonetheless this is an interesting paper, worthy of attention! Here are less gated versions of the paper.
Updated estimates on immigration and wages
In this article we revive, extend and improve the approach used in a series of influential papers written in the 2000s to estimate how changes in the supply of immigrant workers affected natives’ wages in the US. We begin by extending the analysis to include the more recent years 2000-2022. Additionally, we introduce three important improvements. First, we introduce an IV that uses a new skill-based shift-share for immigrants and the demographic evolution for natives, which we show passes validity tests and has reasonably strong power. Second, we provide estimates of the impact of immigration on the employment-population ratio of natives to test for crowding out at the national level. Third, we analyze occupational upgrading of natives in response to immigrants. Using these estimates, we calculate that immigration, thanks to native-immigrant complementarity and college skill content of immigrants, had a positive and significant effect between +1.7 to +2.6\% on wages of less educated native workers, over the period 2000-2019 and no significant wage effect on college educated natives. We also calculate a positive employment rate effect for most native workers. Even simulations for the most recent 2019-2022 period suggest small positive effects on wages of non-college natives and no significant crowding out effects on employment.
That is from a new NBER working paper by Alessandro Caiumi and Giovanni Peri. I wouldn’t say I have massive trust in this kind of estimate. What I do notice, however, is the utter lack of countervailing real wage estimates that show immigration to be a major negative for U.S. native workers.
Trade reform and economic growth
From the excellent Doug Irwin:
Do trade reforms that significantly reduce import barriers lead to faster economic growth? In the twenty-five years since Rodríguez and Rodrik’s (2000) critical survey of empirical work on this question, new research has tried to overcome the various methodological problems that have plagued previous attempts to provide a convincing answer. I examine three strands of recent work on this issue: cross-country regressions focusing on within-country growth, synthetic control methods on specific reform episodes, and empirical country studies looking at the channels through which lower trade barriers may increase productivity. A consistent finding is that trade reforms have had a positive impact on economic growth, on average, although the effect is heterogeneous across countries. Overall, these research findings should temper some of the previous agnosticism about the empirical link between trade reform and economic performance.
Here is my much earlier CWT with Doug Irwin.
The Norwegian ban on smart phones in middle schools
Here is a new paper by Sara Abrahamsson. Perhaps there is Norwegian exceptionalism at work, but the results reflect my expectations reasonably closely. The basic setting is that smart phones were banned in middle school, but at varying (and exogenous) rates around the country. Here are some of the core findings, noting that reading the paper gives some different impressions from some of the Twitter summaries:
1. Grades improve, for instance for the girls it goes up by 0.08 standard deviations. Worth doing, but hardly saving a generation. For girls, the biggest improvement comes in their math scores.
2. The girls consult less with mental health-related professionals, with visits falling by 0.22 on average to their GPs, falling by 2-3 visits to specialist care.
3. “I find no effect on students’ likelihood (extensive margin) of being diagnosed or treated by specialists or GPs for a psychological symptom and diseases.” So more visits, but those visits don’t lead to much.
4. Bullying falls, by 0.42 of an SD for girls, 0.39 of an SD for boys. That is a larger effect than I would have expected.
5. The grade gains are highest for students with lower SES backgrounds.
6. When you look into the details of the data (p.22), the improvement in grades does not seem correlated with the decline in the number of visits to mental health professionals.
So if you ban smart phones from schools, grades go up by a very modest amount, bullying falls by a less modest amount, and actual mental health diagnoses stay the same. In the United States at least, parents seem to hate cellphone bans, because they cannot reach their kids at will.
And there you go. Here is some commentary on the p values in the paper.
Hiring discrimination sentences to ponder
Several common measures — like employing a chief diversity officer, offering diversity training or having a diverse board — were not correlated with decreased discrimination in entry-level hiring, the researchers found.
But one thing strongly predicted less discrimination: a centralized H.R. operation.
The researchers recorded the voice mail messages that the fake applicants received. When a company’s calls came from fewer individual phone numbers, suggesting that they were originating from a central office, there tended to be less bias. When they came from individual hiring managers at local stores or warehouses, there was more. These messages often sounded frantic and informal, asking if an applicant could start the next day, for example.
“That’s when implicit biases kick in,” Professor Kline said. A more formalized hiring process helps overcome this, he said: “Just thinking about things, which steps to take, having to run something by someone for approval, can be quite important in mitigating bias.”
Deregulate our universities
Take a look at how the number of federal regulations and policies governing research at universities has dramatically increased over the years.
This adding an enormous cost of doing research.
(Source COGR) pic.twitter.com/ezqAsLUIIj
— Denis Wirtz (@deniswirtz) April 20, 2024
Via Matt Yglesias.
Tying the Knot
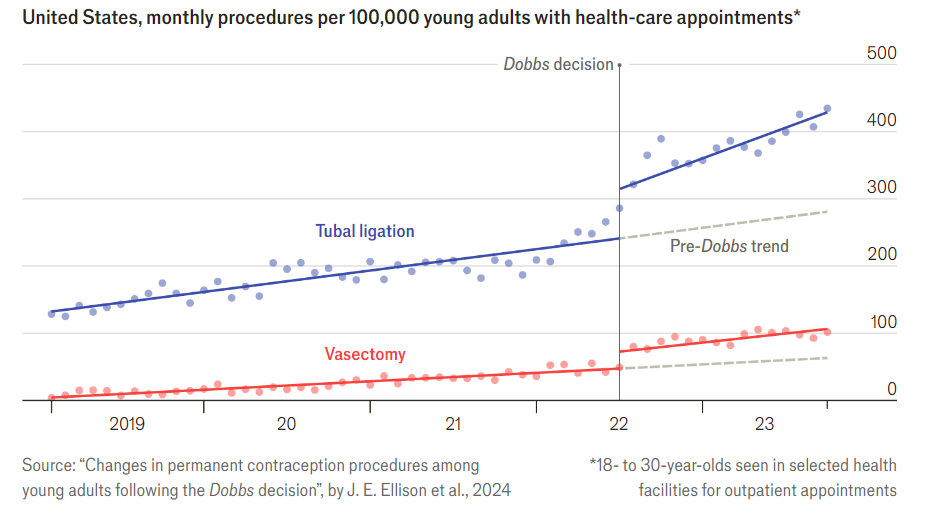
Dobbs, of course, was the Supreme Court decision saying that the constitution does not provide a right to abortion, thus leading to restrictions on abortion in many states. The pictures is from The Economist, the original paper is here.
South Africa fact of the day
Two economists from the Harvard Growth Lab (Shah and Sturzenegger) estimate that the average transport costs for those who are employed in South Africa is equal to 57% of net wages when time to commute is accounted for.
Here is the whole John McDermott tweet storm, in part that is the spatial legacy from the earlier system of apartheid, and in part from poor public transport systems. Here is a related blog post.
Why a Housing Shortage Exists Despite More Houses Per Person
When I post about the skyrocketing price of housing and the need to build, commentators (include some of the most astute commentators on MR), will sometimes object by pointing to the increasing and historically high number of houses per capita. They question how this aligns with rising prices and wave vaguely towards factors like monopoly pricing, hedge funds, Airbnb, vacancies and so forth, implying that more construction isn’t the solution. The real explanation for rising prices amid greater homes per capita is actually quite simple, fewer kids. Kevin Erdmann has an excellent post on this going through the numbers in detail. I will illustrate with a stylized example.
Suppose we have 100 homes and 100 families, each with 2 parents and 2 kids. Thus, there are 100 homes, 400 people and 0.25 homes per capita. Now the kids grow up, get married, and want homes of their own but they have fewer kids of their own, none for simplicity. Imagine that supply increases substantially, say to 150 homes. The number of homes per capita goes up to 150/400 (.375), an all time high! Supply-side skeptics are right about the numbers, wrong about the meaning. The reality is that the demand for homes has increased to 200 but supply has increased to just 150 leading to soaring prices.
Now what do we do about this? One response is to blame people’s choices–immigrants are buying all the houses, hedge funds are buying all the houses, tourists are renting all the houses, everyone should want less and conserve more! Going down this path will tear the country apart. The other response is the American way, in the words of Bryan Caplan’s excellent new book, build, baby, build!
Here’s Kevin:
We are already 15 years into a cultural and economic battle that is so important, it turned the direction of adults per house upward for, likely, the first time since the start of the industrial revolution. Fifteen years in, by that measure, we have reversed economic progress by nearly 40 years. There is so much ground we have to make up. And, also, the reactionary position will have to continue to dig deeper and get worse – rounding up immigrants, blaming the homeless, stoking fear and distrust of financial institutions. I’m sorry if I’m sounding too shrill. It all happens in slow motion around us, so we adapt to the new normal. But the tent encampments in all the urban parks are a long way from what should be considered normal. We are already deeply into a cultural battle. And you can see that it is a cultural battle, because it is difficult to simply establish a plurality of support to admit obvious things.
If this continues, it will destroy the fabric of mutual trust that has managed to miraculously hold this country together for 250 years. The challenge is to open the eyes of enough victims of these policy choices that 50%+1 of the country can address it on the empirical level rather than the aesthetic level, and to stop this devolution before it gets worse.
Hat tip: Naveen.
Response from Devin Pope, on religious attendance
All of this is from Devin Pope, in response to Lyman Stone (and myself). Here was my original post on the paper, concerning the degree of religious attendance. I won’t double indent, but here is Devin and Devin alone:
“I’m super grateful for Lyman’s willingness to engage with my recent research on measuring religious worship attendance using cellphone data. Lyman and I have been able to go back and forth a bit on Twitter/X, but I thought it might be useful to send a review of this to you Tyler.
For starters, I appreciate that Lyman and I agree on a lot of stuff about the paper. He has been very kind by sharing that he agrees that many parts of my paper are interesting and “very cool work”. Where we disagree is about whether the cellphone data can provide a useful estimate for population-wide estimates of worship attendance. Specifically, Lyman’s concerns are that due to people leaving their cellphones at home when they go to church and due to questionable cellphone coverage that might exist within church buildings, the results could be super biased. He sums up his critiques well with the following: “Exactly how big these effects are is anyone’s guess. But I really think you should consider just saying, `This isn’t a valid way of estimating aggregate religious behavior. But it’s a great way to look at some unique patterns of behavior among the religious!’ Don’t make a bold claim with a bunch of caveats, just make the claim you actually have really great data for!” This a very reasonable critique and I’m grateful for him making it.
My first response to Lyman’s concerns is: we agree! I try to be super careful in how the paper is written to discuss these exact concerns that Lyman raises. Even the last line of the abstract indicates, “While cellphone data has limitations, this paper provides a unique way of understanding worship attendance and its correlates.”
Here is where we differ though… To my knowledge, there have been just 2 approaches used to estimate the number of Americans who go to worship services weekly (say, 75% of the time): Surveys that ask people “do you go to religious services weekly?” and my paper using cell phone data. It is a very hard question to answer. Time-use surveys, counting cars in parking lots, and other methods don’t allow for estimating the number of people who are frequent religious attenders because of their repeated cross-sectional designs.
There are definitely limitations with the cellphone data (I’ve had about 100 people tell me that I’m not doing a good job tracking Orthodox Jews!). I know that these issues exist. But survey data has its own issues. Social desirability bias and other issues could lead to widely incorrect estimates of the number of people who frequently attend services (and surveys are going to have a hard time sampling Orthodox Jews too!). Given the difficulty of measuring some of these questions, I think that a new method – even with limitations – is useful.
At the end of the day, one has to think hard about the degree of bias of various methods and think about how much weight to put on each. The degree of bias is also where Lyman and I disagree. In my paper, I document that the cell phone data do not do a great job of predicting the number of people who go to NBA basketball games and the number of people who go to AMC theaters. I both undercount overall attendance and don’t predict differences across NBA stadiums well at all.
The reason why Lyman is able to complain about those results so vociferously is because I’m trying to be super honest and include those results in the paper! And I don’t try to hide them. On page 2 of the paper I note: “Not all data checks are perfect. For example, I undercount the number of people who go to an AMC theater or attend NBA basketball games and provide a discussion of these mispredictions.”
There are many other data checks that look really quite good. For example, here is a Table from the paper that compares cellphone visits as predicted by the cellphone data with actual visits using data from various companies:

The cellphone predictions in the above table tend to do a decent job predicting many population-wide estimates of attendance to a variety of locations. The one large miss is AMC theaters where we undercount attendance by 30%. Now about half of that undercount is because the data are missing a chunk of AMC theaters (this is not due to a cellphone pinging issue, but due to a data construction issue). But even if one were to make that correction, we undercount theater attendance by 15%.
Lyman argues that one should be especially worried about undercounting worship attendance due to people leaving their phones at home. I agree that this is a huge concern that is specific to religious worship and doesn’t apply in the same way for trips to Walmart. I run and report results from a Prolific Survey (N=5k) that finds that 87% of people who attend worship regularly indicate that they “always” or “almost always” take their phone to services with them. So definitely some people are leaving their phones at home, but this survey can help guide our thinking about how large that bias might be. Are Prolific participants representative of the US as a whole? Certainly not. There is additional bias that one should think about in that regard.
Overall, my view is that estimating population-wide estimates for how many people attend religious services weekly is super hard and cellphone data has limitations. My view is that other methods (surveys) also have substantial limitations. I do not think the cellphone data limitations are as large as Lyman thinks they are and stand by the last line of the abstract that once again states, “While cellphone data has limitations, this paper provides a unique way of understanding worship attendance and its correlates.”
All of that was Devin Pope!
Do protests matter?
Only rarely:
Recent social movements stand out by their spontaneous nature and lack of stable leadership, raising doubts on their ability to generate political change. This article provides systematic evidence on the effects of protests on public opinion and political attitudes. Drawing on a database covering the quasi-universe of protests held in the United States, we identify 14 social movements that took place from 2017 to 2022, covering topics related to environmental protection, gender equality, gun control, immigration, national and international politics, and racial issues. We use Twitter data, Google search volumes, and high-frequency surveys to track the evolution of online interest, policy views, and vote intentions before and after the outset of each movement. Combining national-level event studies with difference-in-differences designs exploiting variation in local protest intensity, we find that protests generate substantial internet activity but have limited effects on political attitudes. Except for the Black Lives Matter protests following the death of George Floyd, which shifted views on racial discrimination and increased votes for the Democrats, we estimate precise null effects of protests on public opinion and electoral behavior.
That is from a new NBER working paper by Amory Gethin and Vincent Pons.
Economic growth sentences to ponder, Argentina fact of the day
Sometimes I feel like focusing on policies that only affect growth rates by a few tenths of a percentage point feels small.
But then I remind myself that the difference between the United States and Argentina over the last 120 years was 0.5 percentage point. pic.twitter.com/Pd6SIg1FwS
— Jason Furman (@jasonfurman) April 17, 2024