Category: Data Source
Do older economists write differently?
The scholarly impact of academic research matters for academic promotions, influence, relevance to public policy, and others. Focusing on writing style in top-level professional journals, we examine how it changes with age, and how stylistic differences and age affect impact. As top-level scholars age, their writing style increasingly differs from others’. The impact (measured by citations) of each contribution decreases, due to the direct effect of age and the much smaller indirect effects through style. Non-native English-speakers write in different styles from others, in ways that reduce the impact of their research. Nobel laureates’ scholarly writing evinces less certainty about the conclusions of their research than that of other highly productive scholars.
Here is the full NBER paper by Lea-Rachel and Daniel S. Hamermesh.
*The Two-Parent Privilege*
A new and great book, authored by Melissa S. Kearney of the University of Maryland. The subtitle is How Americans Stopped Getting Married and Started Falling Behind, and here is one excerpt of the summary points:
Two-parent families are beneficial for children.
The class divide in marriage and family structure has exacerbated inequality and class gaps.
Places that have more two-parent families have higher rates of upward mobility.
Not talking about these facts is counterproductive.
The marshaled evidence is convincing, and I will be blogging more about this book. While some stiff competition is coming, this could be the most important economics and policy book of this year. And yes it is remarkable that such a book is so needed, but yes it is. And here is Melissa on Twitter.
Women’s colleges and economics majors
Many observers argue that diversity in Economics and STEM fields is critical, not simply because of egalitarian goals, but because who is in a field may shape what is studied by it. If increasing the rate of majoring in mathematically-intensive fields among women is a worthy goal, then understanding whether women’s colleges causally affect that choice is important. Among all admitted applicants to Wellesley College, enrollees are 7.2 percentage points (94%) more likely to receive an Economics degree than non-enrollees (a plausible lower bound given negative selection into enrollment on math skills and major preferences). Overall, 3.2 percentage points—or 44% of the difference between enrollees and non-enrollees—is explained by college exposure to female instructors and students, consistent with a wider role for women’s colleges in increasing female participation in Economics.
Here is the full NBER paper by . And here is a new paper about the value of HBCUs.
UK fact of the day
Degree-educated millennials in London are 41 per cent less likely to own a home than degree-educated boomers were at the same age. And if you think that’s bad, pity the non-graduate under-40s in London, just 20 per cent of whom own a home (among non-graduate boomers of the same age, 60 per cent were homeowners).
Is the Great Awokening a global phenomenon?
And perhaps it did not start in the United States? Here is more from David Rozado, including a full research paper:
Great Awokening is a global phenomenon. No evidence it started in US media. Analysis of 98 million news articles across 36 countries quantifies. Exception: state-controlled media from China/Russia/Iran using wokeness terminology to criticize/mock the Westhttps://t.co/yHwPMSR4D0 pic.twitter.com/RF30c2UmWQ
— David Rozado (@DavidRozado) April 6, 2023
Do women disagree less in science?
This paper examines the authorship of post-publication criticisms in the scientific literature, with a focus on gender differences. Bibliometrics from journals in the natural and social sciences show that comments that criticize or correct a published study are 20-40% less likely than regular papers to have a female author. In preprints in the life sciences, prior to peer review, women are missing by 20-40% in failed replications compared to regular papers, but are not missing in successful replications. In an experiment, I then find large gender differences in willingness to point out and penalize a mistake in someone’s work.
That is from a new paper by David Klinowski. Via the excellent Kevin Lewis.
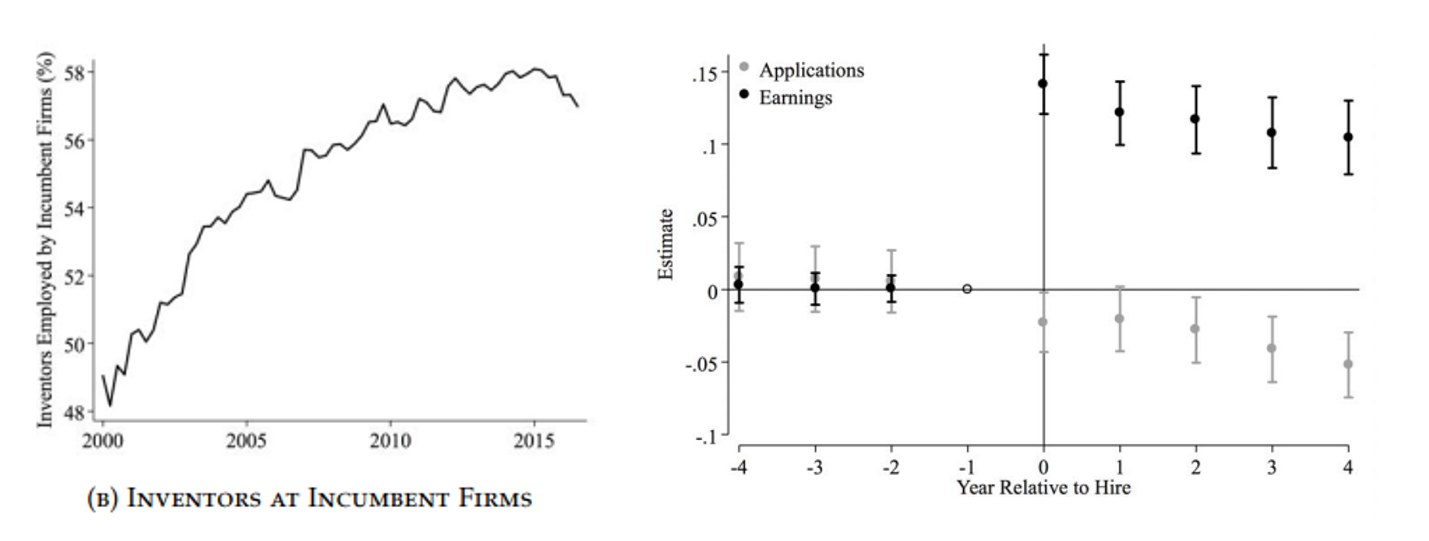
The Arrow Replacement Effect and the Dynamics of US Inventors
anonymized, person-level identifiers, known as Protected Identification Keys (PIKs) so they also have individual data on earnings and employment and they link that data to data on firms.
Ultimately, we observe the employment histories of approximately 760 thousand inventors associated with 3.6 million patents granted between 2000 and 2016.
What they find is twofold. First, an increasing number of inventors are being hired by large incumbent firms (left below). Second, when inventors move to large incumbent firms they earn more but they invent less, compared to similar inventors who go to young firms (right below). Why would an incumbent firm pay more for less productive workers? One possible answer is the Arrow replacement effect, namely a monopolist has less incentive to innovate than a competitive firm becasue the monopolist has a bigger opportunity cost, namely it’s own profits. As Arrow put it: “The preinvention monopoly power acts as a strong disincentive to further innovation.” A logical extension is that a monopolist will be willing to pay not to innovate and one way of doing that is to hire inventors who, if they worked at an entrant, would threaten their monopoly profits.
This is an important paper on declining dynamism in the US economy.
Addendum: In a second paper they use their extensive data to discuss the demographic characteristics of inventors.
Is U.S. deposit outflow an overrated problem?
US bank deposits are a third higher than they were at the start of 2020, which makes worries about a banking system liquidity crisis seem a little overwrought (though, to be fair, it is changes in liquidity, not absolute liquidity levels, that matter most to markets)…
So there was a one-time outflow of about $185bn, or about 3 per cent of small banks’ deposits. The next week, however, small bank deposits were stable. With the usual qualifiers — things can always go wrong later, and so on — US banks do not seem to have a deposit outflow problem.
Here is more from the FT.
The Causal Effect of Economic Freedom on Female Employment & Education
While we have decades of evidence that economically free economies grow faster and are more productive than un-free ones, we have less knowledge about the effect of economic freedom on groups that have traditionally been disadvantaged. I study the causal effects of large and sustained jumps in economic freedom on women’s labor force participation and primary school enrollment. I find that these jumps have a positive and significant effect in both cases–economic freedom is good for women’s labor force opportunities and female education.
That is from Robin Grier at TTU.
Personality Differences and Investment Decision-Making
We survey thousands of affluent American investors to examine the relationship between personalities and investment decisions. The Big Five personality traits correlate with investors’ beliefs about the stock market and economy, risk preferences, and social interaction tendencies. Two personality traits, Neuroticism and Openness, stand out in their explanatory power for equity investments. Investors with high Neuroticism and those with low Openness tend to allocate less investment to equities. We examine the underlying mechanisms and find evidence for both standard channels of preferences and beliefs and other nonstandard channels. We show consistent out-of-sample evidence in representative panels of Australian and German households.
That is from a new NBER working paper from Zhengyang Jiang, Cameron Peng, and Hongjun Yan.
Côte d’Ivoire claim of the day
Côte d’Ivoire citizens pay the highest income taxes in the world according to this year’s survey findings by World Population Review.
While both its sales and corporate tax regimes may be considerably lower than those of other countries globally, at 60%, Côte d’Ivoire’s income tax rates are markedly higher compared to developed countries.
Only Finland (56.95%), Japan (55.97%), Denmark (55.90%), and Austria (55%), closely follow Côte d’Ivoire to round up the top five countries with the highest income tax, in a study that surveyed over 150 countries.
How much people pay of course is yet another matter. Here is the link, via Jodi Ettenberg.
Lifespans of the European Elite, 800-1800
I analyze the adult age at death of 115,650 European nobles from 800 to 1800. Longevity began increasing long before 1800 and the Industrial Revolution, with marked increases around 1400 and again around 1650. Declines in violent deaths from battle contributed to some of this increase, but the majority must reflect other changes in individual behavior. There are historic spatial contours to European elite mortality; Northwest Europe achieved greater adult lifespans than the rest of Europe even by 1000 AD.
Here is the paper by Neil Cummins, via Matt Yglesias.
Are social media making us miserable?
Stuart Richie rebuts some of the recent studies:
And here’s the thing: when the authors of the “Facebook arrival” study raised their standards in this way, running a correction for multiple comparisons, all the results they found for well-being were no longer statistically significant. That is, a somewhat more conservative way of looking at the data indicated that every result they found was statistically indistinguishable from a scenario where Facebook had no effect on well-being whatsoever.
Now let’s turn to the second study, which was a randomised controlled trial where 1,637 adults were randomly assigned to shut down their Facebook account for four weeks, or go on using it as normal. Let’s call it the “deactivating Facebook” study. This “famous” study has been described as “the most impressive by far” in this area, and was the only study cited in the Financial Times as an example of the “growing body of research showing that reducing time on social media improves mental health”.
The bottom-line result was that leaving Facebook for a month led to higher well-being, as measured on a questionnaire at the end of the month. But again, looking in a bit more detail raises some important questions.
First, the deactivation happened in the weeks leading up to the 2018 US midterm elections. This was quite deliberate, because the researchers also wanted to look at how Facebook affected people’s political polarisation. But it does mean that the results they found might not apply to deactivating Facebook at other, less fractious times – maybe it’s particularly good to be away from Facebook during an election, when you can avoid hearing other people’s daft political opinions.
Second, just like the other Facebook study, the researchers tested a lot of hypotheses – and again, they used a correction to reduce false-positives. This time, the results weren’t wiped out entirely – but almost. Of the four questionnaire items that showed statistically-significant results before the correction, only one – “how lonely are you?” – remained significant after correction.
It’s debatable whether even this result would survive the researchers corrected for all the other statistical tests they ran. Not only that, but they also ran a second model, controlling for the overall amount of time people used Facebook, and this found even fewer results than the first one.
Third, as well as the well-being questionnaire at the end of the study, the participants got daily text messages asking them how happy they were, among other questions. Oddly, these showed absolutely no effect of being off Facebook – and not even the slightest hint of a trend in that direction.
Here is the entire piece, which is well thought out.
Time Passages
Here’s an interesting idea it wouldn’t have occured to me to ask. What is the length of time described in the average 250 words of narration and how has this changed over time? Most famously James Joyce’s “Ulysses” is a long novel about single day with many pages describing brief experiences in minute detail. In contrast, Olaf Stapledon’s Last and First Men covers 2 billion years in fewer words than Joyce uses to cover a single day.
Using human readers grading 1000 passages, Underwood et al. (2018) finds that the average length of time described in a typical passage has declined substantially since the 1700s, from a day to about an hour so a decline by a factor of 24. Writers have become much more focused on describing individual experiences than events.

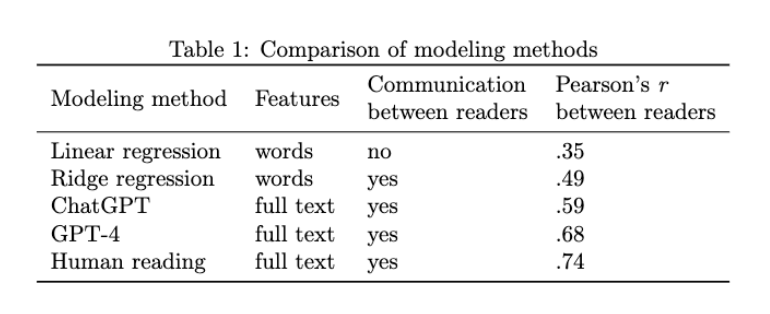
In a blog post, Underwood revisits his earlier work but this time comparing human readers with various statistical techniques and also GPT. To use GPT he prompts
Read the following passage of fiction. Then do five things. 1: Briefly summarize the passage. 2: Reason step by step to decide how much time is described in the passage. If the passage doesn’t include any explicit reference to time, you can guess how much time the events described would have taken. Even description can imply the passage of time by describing the earlier history of people or buildings. But characters’ references to the past or future in spoken dialogue should not count as time that passed in the scene. Report the time using units of years, weeks, days, hours, or minutes. Do not say zero or N/A. 3: If you described a range of possible times in step 2 take the midpoint of the range. Then multiply to convert the units into minutes. 4: Report only the number of minutes elapsed, which should match the number in step 3. Do not reply N/A. 5: Given the amount of speculation required in step 2, describe your certainty about the estimate–either high, moderate, or low. The passage follows: <omitting this to save space>
Here’s an example of the analysis:
ABRIDGED PASSAGE FROM Jane Eyre: And signs, for aught we know, may be but the sympathies of Nature with man. When I was a little girl, only six years old, I one night heard Bessie Leaven say to Martha Abbot that she had been dreaming about a little child … Of late I had often recalled this saying and this incident; for during the past week scarcely a night had gone over my couch that had not brought with it a dream of an infant, which I sometimes hushed in my arms, sometimes dandled on my knee, sometimes watched playing with daisies on a lawn, or again, dabbling its hands in running water. It was a wailing child this night, and a laughing one the next: now it nestled close to me, and now it ran from me; but whatever mood the apparition evinced, whatever aspect it wore, it failed not for seven successive nights to meet me the moment I entered the land of slumber.
ASSISTANT REPLIES.
1: The narrator recalls a saying about dreaming of children being a sign of trouble and remembers an incident from her childhood. She then describes her recent dreams of infants over the past week.
2: The passage mentions the narrator’s childhood memory, which happened when she was six years old, and the past week of dreams. The time elapsed in the passage is the week of dreams.
3: 1 week has elapsed. At seven days a week that’s 7 days. 24 hours in a day, so 168 hours. 60 minutes in an hour, so 10080 minutes.
4: 10080 minutes.
5: Moderate confidence, as the childhood memory is not counted as time passing in the scene.
Overall, Underwood finds that GPT-4 is more accurate than previous statistical techniques in that its judgments correlate with those of human readers nearly as much as human readers correlate with themselves.
Addendum: See also my paper with Tyler on how to use GPT models.
Bike riding is falling in Portland
Overall, Portland bicycle traffic in 2022 dropped more than a third compared to 2019, to levels not seen since approximately 2005-2006 (Table 1). This is based on a comparison of people counted at the 184 locations that were counted in both 2022 and 2019. Volunteers recorded 17,579 people biking at those 184 locations in 2022, a 37% drop from the 27,782 counted at the same locations in 2019. This reversion to earlier and lower volumes is also reflected in bicycle commute data, as well as for driving, walking, and using transit to commute. (Tables 5-6) Looking at data from 2013-2019 we see that bicycling remained relatively flat between 2013 and 2016. However, bicycle counts dropped significantly between 2016 and 2019. This drop is also reflected in census commute data.
And it wasn’t all Covid:
While 2022 data is anomalously low, it is also a continuation of a trend of declining bicycle use in Portland. Both annual count data and Census data demonstrates that bicycle use in Portland peaked in the 2013-2015 period and has been declining since.
Here is the report, here is one abbreviated source. Via Glenn Mercer.
Call me contrarian, but I have never been convinced that bicycles have a promising economic future in a truly Pigouvian city. And as a side point, how popular would bicycles be if they were embedded with software, requiring each bicycle to respect the law, stop at red lights, and so on?