Monday assorted links
Cosmopolitanism vs. nationalism
That is the topic of my latest Bloomberg column. It is hard to excerpt, but here is the closing bit:
The best way for that to happen is to let practical nationalism reign, while at the margin seeking to soften it with moral cosmopolitanism. Both perspectives are valuable, and neither can be allowed to dominate. Each perspective, standing on its own, is intellectually vulnerable, yet the two outlooks together are not quite fully harmonious. It is this dynamic clash, however, that helps to account for the strength of each.
Try explaining all that, and its required background knowledge, in a 280-word tweet. Yet much of the world manages a pretty fruitful balance between moral cosmopolitanism and practical nationalism. There is a wisdom embodied in this lived experience which neither pundits nor philosophers can convey.
A tempered and centrist cosmopolitanism won’t always command the strongest loyalties, nor will practical nationalism always look so pretty. If we can accept that reality, then maybe we can stop throwing stones at each other.
Kevin Hassett to step down as CEA chair
Here are various links, Kevin we shall miss ye…it’s not your grandpa’s Trump administration anymore…
*The New Right: A Journey to the Fringe of American Politics*
That is the new book by Michael Malice, and I have to say it will go down as one of the more important albeit objectionable books of this year. Imagine an well-informed anthropological treatment of Gamergate, PUA, Ann Coulter, Mike Cernovich, Milo, and all the rest of “that stuff,” both its history and how it fits together.
Just to be clear, this book is not written from the perspective of a journalist trying to make these movements look weird, rather it is written from the perspective of an anarchist trying to make these movements look (relatively) normal. You might find that approach is not affiliated with the proper mood. I don’t get the sense that Malice is “one of them,” but his “objectivity” might not be the right kind of objectivity. I’m not going to try to resolve that meta-issue here, I’ll just say that a “normalizing” treatment of “the New Right” has some descriptive virtues, and you might end up more scared and more concerned than if you read a journalistic expose. That said, I am not sure the author really grasps the non-niceness of so much of this stuff, or the import of that non-niceness.
Every page of this book is interesting, and so I am going to recommend it. Here is a Kirkus Review, otherwise MSM doesn’t seem to be touching this one at all. Here is the Amazon link, 79 reviews and an average of five stars. The reviews themselves are not entirely reassuring.
I thank an MR reader for the pointer.
Sunday assorted links
2. The Tony Soprano house is for sale (NYT).
3. “Trump’s four-minute video about the North’s bright future, showed to Kim in Singapore, may have had more effect than observers once suggested. By now it’s clear that rich and poor North Koreans were sorely disappointed by the breakdown in talks with Trump.” Story here.
4. The history of the Laffer Curve. It’s worth noting that Laffer was correct about many of the original applications of the curve. Should there really have been Swedish and British marginal tax rates of 102 or even 95 percent? How soon people forget.
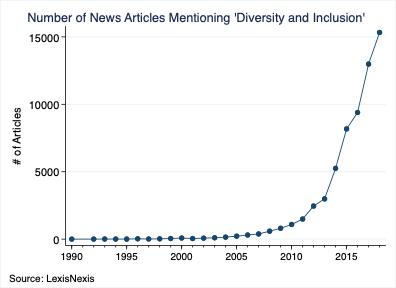
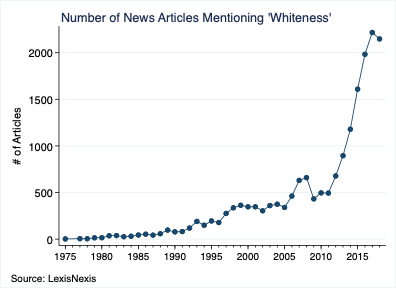
The NYTimes is Woke
Many trends develop over decades but I’ve never seen change so rapid as the breathtaking success of what one might call social justice concerns. Beginning around 2010-2014 there appears to have been a inflection point. Here from Zach Goldberg on twitter are various words drawn from Lexis-Nexis.

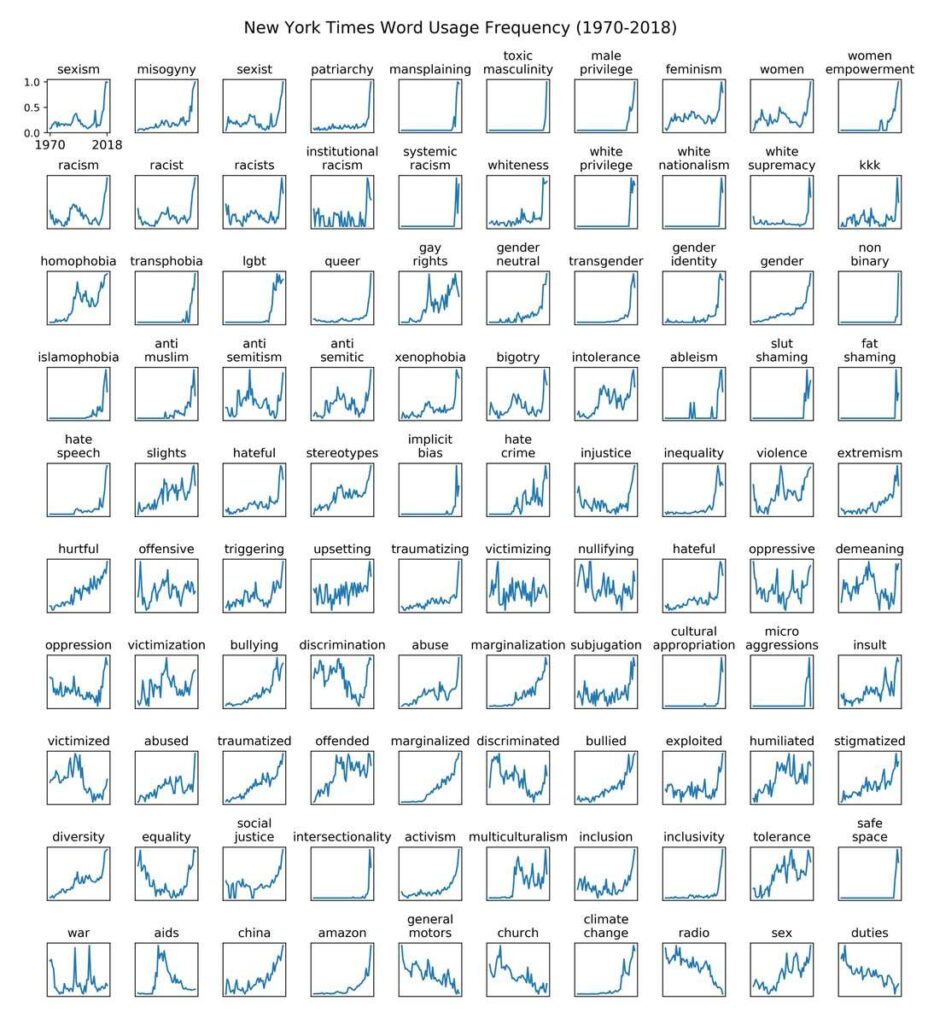 And here from David Rozado is a longer list all drawn from the NYTimes. Rozado has a page where you can graph the trends for words of your own choosing.

The Road Ahead for America’s Colleges & Universities
 We briefly cover higher education in Why Are the Prices So D*mn High? If you are interested in a longer treatment that covers many more issues I highly recommend Archibald and Feldman’s The Road Ahead for America’s Colleges & Universities. Archibald and Feldman reach the same conclusion we do with regard to dysfunction versus the cost disease:
We have offered two contending viewpoints about the drivers of college cost, and we have made a judgement between them. The dysfunction stories form the dominant narrative in public discussion, but we think it’s a story with weak foundations. Yet we agree that the status quo likely costs more than it could or perhaps should. You might notice that we mounted no defense of lazy rivers. Still, the cost consequences of true excesses probably are small. The major drivers of college costs are as follows (1) higher education is a service, and productivity growth in services lags productivity growth in goods; (2) higher education relies on highly educated service providers, and the income gap in favor of highly-educated workers has grown; and (3) higher education institutions adopt technology to meet a standard of care, even if meeting that standard pushes up cost.
In addition to discussing costs, Archibald and Feldman look at the demand for college, the role of the federal and state governments, online education, policy proposals such as free college and much more. Throughout their book they are data driven, analytic, and judicious.
UK Tory fact of the day
In the UK, Conservative party membership has been dwindling for decades. At its peak, in the early 50s, it was 2.8 million. Last year, it was 124,000 and the party received twice as much money from dead members, through wills, as from the living.
That is from a longer Andy Bennett piece on the deepening crisis in conservatism.
The dark side of the internet, in a nutshell?
As incentives to take higher actions increase—due to higher stakes or more manipulable signaling technology—more information is revealed about gaming ability, and less about natural actions. We explore a new externality: showing agents’ actions to additional observers can worsen information for existing observers. Applications to credit scoring, school testing, and web searching are discussed.
That is from a forthcoming JPE paper “Muddled Information,” by Alex Frankel and Navin Kartik.
Saturday assorted links
1. Somehow, American racism exploded in 2010-2012. Recommended (model this).
4. Gay stereotyping deracializes somewhat.
5. Are rare earths a paper tiger?
6. Was Scandinavian gender equality also high in Viking times?
Heritability of lifetime earnings
Using twenty years of earnings data on Finnish twins, we find that about 40% of the variance of women’s and little more than half of men’s lifetime labour earnings are linked to genetic factors. The contribution of the shared environment is negligible. We show that the result is robust to using alternative definitions of earnings, to adjusting for the role of education, and to measurement errors in the measure of genetic relatedness.
That is from a newly published paper by Ari Hyytinen, Pekka Ilmakunnas, Edvard Johansson, and Otto Toivanen.
How much of education is signaling? — yet again
The social and the private returns to education differ when education can increase productivity and also be used to signal productivity. We show how instrumental variables can be used to separately identify and estimate the social and private returns to education within the employer learning framework of Farber and Gibbons (1996) and Altonji and Pierret (2001). What an instrumental variable identifies depends crucially on whether the instrument is hidden from or observed by the employers. If the instrument is hidden, it identifies the private returns to education, but if the instrument is observed by employers, it identifies the social returns to education. Interestingly, however, among experienced workers the instrument identifies the social returns to education, regardless of whether or not it is hidden. We operationalize this approach using local variation in compulsory schooling laws across multiple cohorts in Norway. Our preferred estimates indicate that the social return to an additional year of education is 5%, and the private internal rate of return, aggregating the returns over the life-cycle, is 7.2%. Thus, 70% of the private returns to education can be attributed to education raising productivity and 30% to education signaling workers’ ability.
That is from a new NBER Working Paper by Gaurab Aryal, Manudeep Bhuller, and Fabian Lange. You can enter “education signaling” into the MR search function for much more on this ongoing debate.
Friday assorted links
The Baumol Effect
After looking at education and health care and doing a statistical analysis covering 139 industries, Helland and I conclude that a big factor in price increases over time in the rising price of skilled labor. Many industries use skilled labor, however, and even so prices decline so that cannot be a full explanation. Moreover, why is the price of skilled labor increasing? The Baumol effect answers both of these questions. In this post, I’ll explain the effect drawing from Why Are the Prices so D*mn High.
The Baumol effect is easy to explain but difficult to grasp. In 1826, when Beethoven’s String Quartet No. 14 was first played, it took four people 40 minutes to produce a performance. In 2010, it still took four people 40 minutes to produce a performance. Stated differently, in the nearly 200 years between 1826 and 2010, there was no growth in string quartet labor productivity. In 1826 it took 2.66 labor hours to produce one unit of output, and it took 2.66 labor hours to produce one unit of output in 2010.
Fortunately, most other sectors of the economy have experienced substantial growth in labor productivity since 1826. We can measure growth in labor productivity in the economy as a whole by looking at the growth in real wages. In 1826 the average hourly wage for a production worker was $1.14. In 2010 the average hourly wage for a production worker was $26.44, approximately 23 times higher in real (inflation-adjusted) terms. Growth in average labor productivity has a surprising implication: it makes the output of slow productivity-growth sectors (relatively) more expensive. In 1826, the average wage of $1.14 meant that the 2.66 hours needed to produce a performance of Beethoven’s String Quartet No. 14 had an opportunity cost of just $3.02. At a wage of $26.44, the 2.66 hours of labor in music production had an opportunity cost of $70.33. Thus, in 2010 it was 23 times (70.33/3.02) more expensive to produce a performance of Beethoven’s String Quartet No. 14 than in 1826. In other words, one had to give up more other goods and services to produce a music performance in 2010 than one did in 1826. Why? Simply because in 2010, society was better at producing other goods and services than in 1826.
The 23 times increase in the relative price of the string quartet is the driving force of Baumol’s cost disease. The focus on relative prices tells us that the cost disease is misnamed. The cost disease is not a disease but a blessing. To be sure, it would be better if productivity increased in all industries, but that is just to say that more is better. There is nothing negative about productivity growth, even if it is unbalanced.
In this post, I will discuss some implications of the fact that productivity is unbalanced. See the book for more discussion and speculation about why productivity growth is systematically unbalanced.
The Baumol effect reminds us that all prices are relative prices. An implication is that over time prices have very little connection to affordability. If the price of the same can of soup is higher at Wegmans than at Walmart we understand that soup is more affordable at Walmart. But if the price of the same can of soup is higher today than in the past it doesn’t imply that soup was more affordable in the past, even if we have done all the right corrections for inflation.
We can see this in the diagram at right. We have a two-good economy, Cars and Education. The production possibilities frontier shows all the combinations of Cars and Education that we can afford given our technology and resources at time 1 (PPF 1). Now suppose society chooses to consume the bundle of goods denoted by point (a). The relative price of Cars and Education is given by the slope of the PPF at that point. That price/slope tells us if we give up some education how many more cars can we get? In a market economy the price has to be given by the slope of the PPF because that is the only price at which people will willing consume the bundle of goods at point (a), i.e. it’s the equilibrium price.
Now at time 2, productivity has increased which means that with the same resources we can now have more of both goods. Productivity of Car production has increased more than that of Education production, however, so the curve shifts out more towards Cars than towards Education. Suppose society continues to consume Cars and Education in the same proportions, i.e. at point (b). The price of education must increase–and all that means is that if we give up a unit of education at point b we will get more cars than before which is the same as saying that if we want more education at point b we must give up more cars than before, i.e. the price has increased.
Notice, however, that although the price of education has increased, education is not less affordable. Indeed, at point (b) we are consuming more of both goods–broadly speaking this is exactly what has happened–namely, the price of education has increased and we now consume more of it than ever before.
When we recognize that all prices are relative prices the following simple yet deep facts follow:
- If productivity increases in some industries more than others then, ceteris paribus, some prices must increase.
- Over time, all real prices cannot fall.
In Figure 22 the economy moves from point (a) to point (b). If we graph the same transition over time it will look something like Figure 23.
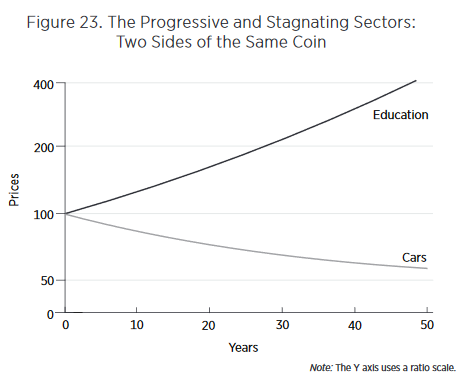
Looking at such graphs, our attention naturally is drawn to the rising cost of education. Why are costs rising so quickly? Entranced by such graphs, we may enter into a detailed analysis of the special factors of education—regulation, unionization, government purchases, insurance, international trade, and so forth—to try to explain the dramatic increase in costs. Yet the rising costs in the education sector are simply a reflection of increased productivity in the car sector. Thus, another deep lesson of the Baumol effect is that to understand why costs in the stagnant sector are rising, we must look away from the stagnating sector and toward the progressive sector.
Finally, there is one other addition to the Baumol effect which is not often recognized but worth drawing attention to. In Figure 22, I assumed that preferences were such that people wanted to consume the same ratio of goods over time so we moved from point (a) to point (b). But suppose that as we get wealthier we get tired of more cars and would like relatively more education so we move towards point (d). As we move from point (b) to point (d) we are taking resources away from car production, resources which were probably well-suited to making cars, and instead moving them towards education where they are probably less well suited. As a result as we move from point (b) to point (d) we are driving up the price of education as we try to turn auto workers into teachers. In this case, the Baumol effect gets magnified. We could alternatively move from point (b) to point (c) which would turn teachers into less productive auto workers thus driving down the price of education (i.e. increasing the price of cars). Thus, depending on preferences, the Baumol effect can be magnified or ameliorated.
As a society it appears that with greater wealth we have wanted to consume more of the goods like education and health care that have relatively slow productivity growth. Thus, preferences have magnified the Baumol effect.
Next week, I will wrap up the discussion by explaining some features of the data that the Baumol effect fits much better than do other theories.
Addendum: Other posts in this series.
Might Facebook boost wages?
In this paper, I estimate the causal effect of increased exposure to online social networks during college on future labor market outcomes.
Using quasi-random variation from Facebook’s entry to college campuses during its infancy, I exploit a natural experiment to determine the relationship between online social network access and future earnings.
I find a positive effect on wages from Facebook access during college. This positive effect is largest in magnitude for female students, and students from lower-middle class families.
I provide evidence that this positive effect from Facebook access comes through the channel of increased social ties to former classmates, which in turn leads to strengthened employment networks between college alumni.
My estimates imply that access to Facebook for 4 years of college causes a 2.7 percentile increase in a cohort’s average earnings, relative to the earnings of other individuals born in the same year. This translates to an average nominal wage increase of $3,000-$5,000 in 2014.
To be clear, some of that could be a wage distribution effect. Still, this paper points to the possibility of some very real networking and matching gains from the use of Facebook, and perhaps those gains do not favor traditional elites.
For the pointer I thank the excellent Kevin Lewis.