Category: Data Source
Nate Silver’s 538 is up and running
You will find it here.
Here is a piece on economic data. What it says is fine, but it won’t interest me. I wished this piece on hockey goalies had been longer and more analytic. The same is true for this piece on corporations hoarding cash, which also could use more context. Maybe it is I rather than they who is misjudging the market, but to me these are “tweener” pieces, too superficial for smart and informed readers, yet on topics which are too abstruse for the more casual readers. I want something more like the very good Bill Simmons analytic pieces on Grantland, with jokes too, and densely packed narrative, yet applied to a much broader range of topics. Barring that, I am happy to read one very good sentence or two on a topic.
Here is a piece on whether guessing makes sense on the new SAT. It is fine but presents material already covered in places such as NYT.
Here is Silver’s introductory essay as to what they are about. It is too sprawling and evinces a greater affiliation to rigor with data analysis than to rigor with philosophy of science or for that matter rigor with rhetoric.
I have long been a fan of Nate Silver, but so far I don’t think this is working.
Interview with Nate Silver about 538
Here is an excellent interview with Nate Silver about his new project, interesting throughout. Here is one bit:
People also think it’s going to be a sports site with a little politics thrown in, or it’s going to be a politics site with sports thrown in. I understand why people say that — what we’ve been known for, plus ESPN, plus ABC News. But we take our science and economics and lifestyle coverage very seriously.
Some of the interview made me a little nervous. He inveighs against New York Times Op-Ed columnists (juicy passages, click on the link if you wish), but their knowledge is more synthetic and also more novel than I think Silver recognizes. I am not sure why “predictable” points of view are necessarily less likely to be true, or less likely to be important, even though they are (to me as well) less interesting to read.
Here are some more words from Silver:
We’re not sociopaths, which means that we look at the world and have opinions. But we’re not trying to do advocacy here. We’re trying to just do analysis. We’re not trying to sway public opinion on anything except trying to make them more numerate. I would say we’re not going to do a ton of public-policy coverage. We think that space is pretty rich now with competition. I also think with something like the health-care bill, it’s going to take years to get a good sense of how that’s working and how it’s affecting the market.
That too makes me a little nervous. For instance there is the risk of assuming that the most important issues always or usually involve measurement. Technocrats who rail against the ideologies of others are often the most ideological people around, even if their biases do not line up with the political spectrum in the usual manner. Is there really such a thing as “just do analysis”? Is it not better to make the underlying value presuppositions more explicit? And why the knock at people who don’t have opinions about public affairs? They’re not sociopaths, and frankly I’m not even fully comfortable with a blanket condemnation of sociopaths.
Earlier today I was reading John Hauer’s excellent The Natural Superiority of Mules. It is a deliberately species-ist book, without a shred of objectivity, and the title reveals the blatant biases of the author. The book has data, but is not data-driven. It is “advocacy of mules driven.” Get the subtitle: “A Celebration of One of the Most Intelligent, Sure-Footed, and Misunderstood Animals in the World” (eyes roll). Yet I learned a great deal from it, and I will read any web site that can do as well.
Russia and Ukraine facts of the day
The World Bank lists Russia at $14,037 per capita income.
That same source lists Ukraine at $3,867.
Russian per capita income is slightly more than 3.6 times higher. I am not suggesting that Crimea will now experience an economic boom, but this differential is worth keeping in mind as the issue unfolds.
Admittedly the Russian incomes are distributed quite inequitably (Gini of 40 compared to 26 for Ukraine), which lowers the attraction of belonging to that country.
The Great Male Reset
Men between the ages of 25 and 54 are in their prime working years. Generally speaking, they’re too old for college and too young for retirement.
In February 2008, 87.4 percent of men in that demographic had jobs.
Six years later, only 83.2 percent of men in that bracket are working.
That is from Binyamin Appelbaum.
Economic growth in Ukraine, a recent history
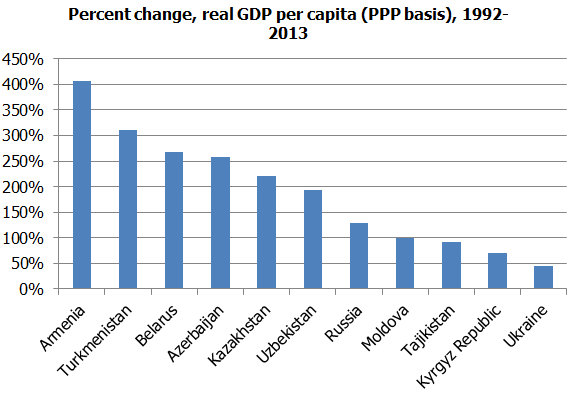
From C.W. at Free Exchange, there is more here.
Money, Status, and the Ovulatory Cycle (politically incorrect paper of the month)
That is a new research paper by Kristina M. Durante, Vladas Griskevicius, Stephanie M. Cantú , and Jeffry A. Simpson, and the abstract is here:
Each month, millions of women experience an ovulatory cycle that regulates fertility. Previous consumer research has found that this cycle influences women’s clothing and food preferences. The authors propose that the ovulatory cycle actually has a much broader effect on women’s economic behavior. Drawing on theory in evolutionary psychology, the authors hypothesize that the week-long period near ovulation should boost women’s desire for relative status, which should alter their economic decisions. Findings from three studies show that women near ovulation seek positional goods to improve their social standing. Additional findings reveal that ovulation leads women to pursue positional goods when doing so improves relative standing compared with other women but not compared with men. When playing the dictator game, for example, ovulating women gave smaller offers to a female partner but not to a male partner. Overall, women’s monthly hormonal fluctuations seem to have a substantial effect on consumer behavior by systematically altering their positional concerns, a finding that has important implications for marketers, consumers, and researchers.
Here is some popular coverage of the piece. For the pointer I thank C.
Catholics were much less likely to vote for the Nazis
A new paper was presented at the AEA meetings this January, “Religion, Economics, and the Rise of the Nazis,” by Philipp Tillman and Jörg Spenkuch, and the abstract for one version of the paper is this:
We investigate the role of religion in the electoral success of the Nazi Party in Weimar Germany. Among historians, it is a well known fact that Protestants were much more likely than Catholics to vote for Adolf Hitler. However, in spite of the historical importance of the Nazis’ rise to power, the question of whether this correlation reflects a causal effect of religion has so far remained unanswered. We use an instrumental variable approach by relying on geographic variation in religious beliefs dating back to a peace treaty in the sixteenth century. According to the principle “cuius regio, eius religio.” the Peace of Augsburg granted local rulers the right to determine the religion of their serfs. Using rulers’ choices in the aftermath of the peace as an instrumental variable for the religion of Germans living in the respective areas more than three hundred years later, we are able to document an economically large effect of Protestantism on Nazi vote shares— even after controlling for a wide range of region fixed effects and socioeconomic characteristics. Taken at face value, our estimates suggest that Catholics were about 50% less likely to vote for the Nazi Party than their Protestant counterparts. We are currently testing multiple hypotheses to explain this effect and are in the process of collecting additional data.
That is not a new claim but it is new to have serious econometrics to back it up and show the vote tallies were not caused by associated demographic factors. You will find a related copy of the paper at the first link here. Tillman’s home page is here. Spenkuch is here. Here is Spenkuch’s paper on immigration and crime. Immigration is connected to higher rates of theft crime, although by small amounts, and not positively related to violent crime.
Addendum: Here is the most current version of the paper (pdf), with notable additions.
Is Islamic political control bad for women’s empowerment?
Maybe not, once we control properly for endogeneity:
Islamic Rule and the Empowerment of the Poor and Pious
Erik Meyersson
Econometrica, January 2014, Pages 229–269Abstract:
Does Islamic political control affect women’s empowerment? Several countries have recently experienced Islamic parties coming to power through democratic elections. Due to strong support among religious conservatives, constituencies with Islamic rule often tend to exhibit poor women’s rights. Whether this reflects a causal relationship or a spurious one has so far gone unexplored. I provide the first piece of evidence using a new and unique data set of Turkish municipalities. In 1994, an Islamic party won multiple municipal mayor seats across the country. Using a regression discontinuity (RD) design, I compare municipalities where this Islamic party barely won or lost elections. Despite negative raw correlations, the RD results reveal that, over a period of six years, Islamic rule increased female secular high school education. Corresponding effects for men are systematically smaller and less precise. In the longer run, the effect on female education remained persistent up to 17 years after, and also reduced adolescent marriages. An analysis of long-run political effects of Islamic rule shows increased female political participation and an overall decrease in Islamic political preferences. The results are consistent with an explanation that emphasizes the Islamic party’s effectiveness in overcoming barriers to female entry for the poor and pious.
There are ungated versions here. That is via Kevin Lewis, who surveys other interesting papers on religion here.
Childhood obesity is falling
Federal health authorities on Tuesday reported a stunning 43 percent drop in the obesity rate among 2- to 5-year-old children over the past decade, the first broad decline in an epidemic that often leads to lifelong struggles with weight and higher risks for cancer, heart disease and stroke.
The drop emerged from a major federal health survey that experts say is the gold standard for evidence on what Americans weigh. The trend came as a welcome surprise to researchers. New evidence has shown that obesity takes hold young: Children who are overweight or obese between age 3 and 5 are five times as likely to be overweight or obese as adults.
There is more here, via Charles C. Mann.
Swear words on Twitter
In daily life it is thought that between 0.5% and 0.7% of the words we use are swearwords, but the proportion on the site is roughly twice this, at 1.15%. According to this study, about one in every 13 tweets contains a swearword of some kind.
Intriguingly, swearing also seems to be an early-week thing. Tweets become more and more likely to contain a swearword as the day progresses, perhaps reflecting the accumulation of things we have to swear about, and peak profanity is reached between midnight and 1.30am, suggesting that people who are awake at that time are, let’s say, the least inhibited. Yet Friday, Saturday and Sunday are consistently the least sweary days of the week.
Please note there are specific swear words (with data) at this link. And there are lulls during lunch time.
For the pointer I thank Michelle Dawson.
Ukraine vs. Argentina, which country is more likely to default?
From a loyal MR reader, with some editing by me:
Ukraine default risk is way up, but Ukraine has barely closed the gap with Venezuela in the default probability race and Argentina, with its pari-passu case now under review for cert at the Supreme Court, is still way ahead with its CDS-implied likelihood of default. I know its hard to look at pictures of Kiev and think “that looks like a safe sovereign credit,” but even with the recent run-up Ukraine still has a market-implied default hazard at only about 60% of the level of Argentina.
Those are some graphs at the link from the CDS-implied default probabilities page from Deutsche Bank.
Part of the run-up in the Ukraine and Venezuela insurance prices is due to Argentina’s repeated losses in their pari-passu case. Should they be denied cert or lose at the Supreme Court, other nations with pari-passu clauses will find it both difficult to restructure and harder to selectively default. That is driving up CDS rates across the risky sovereign space, mostly because of lower recovery in CDS settlement auctions. On related issues with pari passu see this law and econ paper.
The difference between Ukraine and Argentina probably says something about the importance of willingness to pay versus ability to pay and willingness to pay is what really matters.
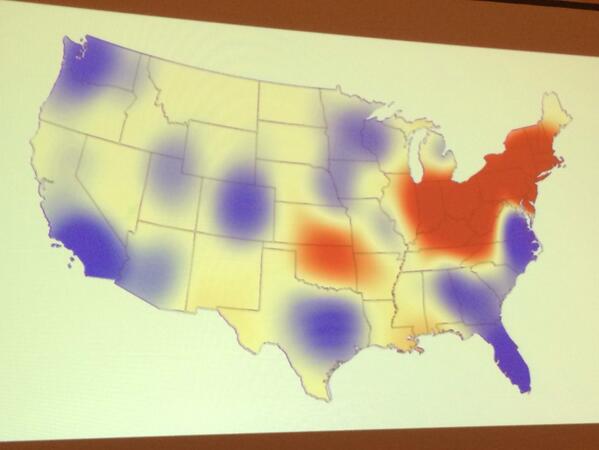
Personality by region
As indicated by words on blogs: red is high neurotic, blue is low. Highly speculative of course:
Improving GDP
Under EU rules Britain will add illegal drug sales and prostitution to its calculations of GDP:
HPost: Britain makes £10 billion a year thanks to drug dealers and prostitutes, the government’s statistics watchdog is set to confirm.
The Office for National Statistics is expected to comply with new EU rules by revealing its first estimates for the size of the illegal industries and how it has reached these calculations as soon as March or April.
Prostitution in Britain is set to be valued at around £3 billion a year while the drug dealing sector is set to be valued at £7 billion, with both of them factored into the UK’s £1.6 trillion gross domestic product, according to the Times.
Are natural scientists smarter?
Social science professors at elite institutions are more likely to be religious and politically extreme than their counterparts in the natural sciences, argues a new paper in the Interdisciplinary Journal on Research and Religion. The reason? Natural scientists are just smarter, it says.
“There is sound evidence of a negative correlation between intelligence and religiosity and between intelligence and political extremism,” reads the paper, which examines existing data on academic scientists’ IQs by field, and on religious beliefs and political extremism among science professors in the U.S. and Britain. (An abstract of the paper is available here.) “Therefore the most probable reason behind elite social scientists being more religious than are elite physical scientists is that social scientists are less intelligent.”
The paper, written by Edward Dutton, adjunct professor of cultural anthropology at the University of Oulu, in Finland, and Richard Lynn, a retired professor of psychology from the University of Ulster, in Northern Ireland, who is known for his work on race and IQ, continues: “Intelligence is also a factor in interdisciplinary differences in political extremism, [with] physicists, who have high IQs, being among the least extreme and lower-IQ scholars being among the most extreme.”
There is more here, though I will note, without wishing to offend anyone in particular, that just about all of us are capable of being spectacularly dense, natural scientists included and these authors too. I believe these correlations, to the extent they are true, are better explained by sociological factors than by IQ. In the United States for instance various brands of humanities professors are in fact remarkably secular and I take this to be a stamp of a particular kind of affiliation to (and against) other social groups, not a sign of IQ in either direction. Note also that political extremism has to select against low IQ at some margins, if only because the extreme doctrine involves a complicated ideological apparatus of some sort rather than just “folk morality.”
By the way, here is Dutton’s earlier 2010 piece “Why did Jesus Go To Oxford University?” (pdf), which suggests the smarter and more creative students are more likely to have evangelical religious experience.
Do more popular people shy away from controversial Facebook discussions?
There is a new paper by Jang SM, Lee H, and Park YJ, here is the rather depressing abstract:
Abstract Although previous research has indicated that Facebook users, especially young adults, can cultivate their civic values by talking about public matters with their Facebook friends, little research has examined the predictors of political discussion on Facebook. Using survey data from 442 college students in the United States, this study finds that individual characteristics and network size influence college students’ expressive behavior on Facebook related to two controversial topics: gay rights issues and politics. In line with previous studies about offline political discussion, the results show that conflict avoidance and ambivalence about target issues are negatively associated with Facebook discussions. Perhaps the most interesting finding is that users who have a large number of Facebook friends are less likely to talk about politics and gay rights issues on Facebook despite having access to increasing human and information resources. Theoretical implications of these findings and future directions are addressed.
The link to the paper is here. Of course one possibility is that popular people do not want to endanger their popularity with controversial discussions. Another is that non-controversial people are simply more popular to begin with.
Hat tip goes to @Neuroskeptic.