Category: Data Source
The Private Rationality of Bottled Water Drinking?
That is a new paper by W. Kip Viscusi, Joel C. Huber, and Jason Bell, the abstract is here:
This article examines evidence for the private rationality of decisions to choose bottled water using a large, nationally representative sample. Consumers are more likely to believe that bottled water is safer or tastes better if they have had adverse experiences with tap water or live in states with more prevalent violations of EPA water quality standards. Perceptions of superior safety, taste, and convenience of bottled water boost consumption of bottled water. Blacks and Hispanics are more likely to drink bottled water due to their relatively greater exposure to unsafe water and greater risk beliefs. The coherent network of experiences, beliefs, and actions is consistent with rational consumer choice.
That is rationality at the margin, of course, as the entire practice of bottled water in developed countries strikes me as not rational for most people. Tap water is fine and to me even tastes better.
Hat tip goes to www.bookforum.com.
Income volatility for top earners, especially in finance
Justin Lahart has a new article about research in the works on top earners, here is one relevant snippet:
The economists have also been looking into what’s going on with the top 0.1%, while digging more deeply into incomes for specific occupations. In a preview of this work he presented at the American Economic Association’s annual meeting last month, Mr. Guvenen showed that over the past 30 years income cyclicality for this group has risen substantially relative to the population at large.
That is largely a result of a change in the composition. It used to be that doctors — a group with very little income cyclicality — represented about a quarter of top 0.1%. Now they account for less than a tenth. Filling the gap, a bigger share of people in finance-related occupations.
The underlying research you will find here. For the pointer I thank Ray Lopez.
*The Son Also Rises* and social mobility in India
That is the new Greg Clark book and yes it is an event and yes you should buy it. Here is one passage I found of interest:
There are surprisingly few studies of social mobility in India. Thus the two recent international surveys of social mobility…do not include India. However, a recent study estimated the Indian intergeneration income correlation to be 0.58, making social mobility rates in India among the world’s lowest.
The estimated persistence rate for income in India of 0.58, however, is not much higher than those for the United Kingdom (0.5) or the United States (0.47). The share of income variance in the next generation attributable to inheritance from parents in India is still only (0.58)squared, or 0.34. This suggests that even in India, an individual’s position in the income ranks is not primarily derived from inheritance. Thus, by conventional estimates, modern India has become a society of rapid social mobility, where three to four generations might see the elimination of all traces of millennia-old patterns of inequality.
You can buy the book here. Here is a previous MR post on the book, there will be more to come.
How much snow it takes to cancel school
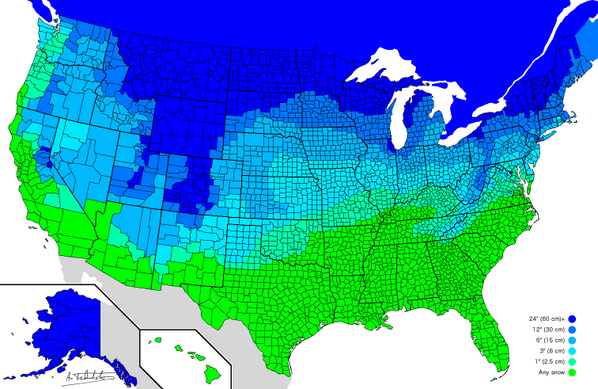
The pointer is from Ángel Cabrera, link here.
What happens when we correct for publication bias?
There is a recent paper by Leif D. Nelson, Uri Simonsohn, and Joseph P. Simmons on this topic, the abstract is this:
Journals tend to publish only statistically significant evidence, creating a scientific record that markedly overstates the size of effects. We provide a new tool that arrives at unbiased effect size estimates while fully ignoring the unpublished record. It capitalizes on the fact that the distribution of significant p-values, p-curve, is a function of the true underlying effect. Researchers armed with only the sample sizes and p-values of the published findings can fully correct for publication bias. We demonstrate the use of p-curve by reassessing the evidence for the impact of “choice overload” from the Psychology literature, and the impact of minimum wage on unemployment from the Economics literature.
When it comes to both the choice overload effect and the minimum wage, correcting for publication bias implies a lack of significance in the overall tenor of the results. In passing I am not sure the minimum wage is the best example here, since a “no result” paper on that question seems to me entirely publishable these days and indeed for some while.
For the pointer I thank Kevin Lewis. And Kevin Drum adds comment.
How much does social mobility ever change?
Here is Dylan Matthews interviewing Gregory Clark about his new book The Son also Rises:
Another remarkable feature of the surname data is how seemingly impervious social mobility rates are to government interventions. In all societies, what seems to matter is just who your parents are. At the extreme, we see in modern Sweden an extensive system of public education and social support. Yet underlying mobility rates are no higher in modern Sweden than in pre-industrial Sweden or medieval England.
There was one case where government interventions did seem to promote mobility, which was in Bengal, in India. There the strict quota system in educational institutions had benefited significantly people with surnames associated with the Scheduled Castes.
But the bizarre element here is that these quotas did not help those truly at the bottom of the social ladder. Instead, the benefits went to families of average social status whom the British had mistakenly classified as Scheduled Caste. These families have now become a new elite. The truly disadvantaged, such as the large Muslim community, have been correspondingly further burdened by being excluded from these quotas.
Interestingly, in China, the extreme social intervention represented by the Communist Revolution of 1949, which included executing large numbers of members of the old upper class, has not resulted in much of an increase in social mobility. Surnames of high status in the Imperial and Republican era continue to be overrepresented among modern elites, including Communist Party officials.
The families that have high social competence, whatever the social system is, typically find their way to the top of the social ladder.
The interview is interesting throughout. And you will of course note the new Chetty results — created with entirely different methods and data — showing economic mobility has not much changed in the United States for decades.
For the initial pointer I thank Samir Varma.
How average is perceived as being over
If you actually take a close look at the numbers, it turns out that of the people who identified as middle class in 2008, nearly a third of them now identify as lower middle or lower class.1 This is even more dramatic than it seems. Class self-identification is deeply tied up with culture, not just income, and this drop means that a lot of people—about one in six Americans—now think of themselves as not just suffering an income drop, but suffering an income drop they consider permanent. Permanent enough that they now live in a different neighborhood, associate with different friends, and apparently consider themselves part of a different culture than they did just six years ago.
There is more here, from Kevin Drum.
Economic data on hitmen
The sample is pretty limited, but here is what they find:
The killers typically murder their targets on a street close to the victim’s home, although a significant proportion get cold feet or bungle the job, according to criminologists who examined 27 cases of contract killing between 1974 and 2013 committed by 36 men (including accomplices) and one woman.
…The reality of contract killing in Britain tended to be striking only in its mundanity, according to David Wilson, the university’s professor of criminology. He said: “Far from the media portrayal of hits being conducted inside smoky rooms, frequented by members of an organised crime gang, British hits were more usually carried out in the open, on pavements, sometimes as the target was out walking their dog, or going shopping, with passersby watching on in horror.”
Researchers found that the average cost of a hit was £15,180, with £100,000 being the highest and £200 the lowest amount paid. The average age of a hitman was 38 with the youngest aged 15 and the oldest 63.
The youngest, Santre Sanchez Gayle from north London, shot dead a young woman at point-blank range with a sawn-off shotgun in 2010 after she answered her front door. The oldest was David Harrison who, also in 2010, shot the owner of a skip-hire business in his Staffordshire home.
Most hits involved a gun, with three victims stabbed, five beaten to death and two strangled. The most conspicuous weapon was used in the killing of David King, a widely feared underworld figure known as “Rolex Dave”, who in 2003 was shot five times as he emerged from a Hertfordshire gym by hitman Roger Vincent and his accomplice David Smith, both 33. The killing was the first time an AK-47 assault rifle – apparently belonging to the Hungarian prison service – had been used on a British street.
For the pointer I thank Mike Brown. By the way, those records are focused on Birmingham, England, which perhaps is not like Lodi, New Jersey in this regard.
The original work is cited as appearing in the Howard Journal of Criminal Justice, but I do not seem to find the article at that link.
Claims about coal
Counterfactual estimates of city population sizes indicate that our estimated coal effect explains at least 60% of the growth in European city populations from 1750 to 19o0.
That is from a new NBER working paper by Alan Fernihough and Kevin Kevin Hjortshøj O’Rourke. There is an ungated version of the paper here.
The North Carolina unemployment insurance experiment may be looking up
The benefits have been stopped, and there has been much recent debate over how well this is working to stimulate reemployment. This new study is from Kurt Mitman, who is a doctoral candidate at U. Penn and an NBER research associate, here is his summary:
1. Evidence from the establishment survey confirms a substantial increase in employment in North Carolina following the unemployment insurance reform.
2. The increase in payroll employment reported by the sample of North Carolina employers is smaller than the increase in employment reported by workers in the household survey.
3. The increase in employment [is] driven by the private service sector.
4. A comparison of the growth in employment between North Carolina and the adjacent states in Figure 5 reveals a similar growth in the post-reform period between the two Carolinas, which is much faster growth than in Virginia.
5. Results in Table 3 reveal a mild tendency toward higher weekly hours post reform and little change in wages and earnings.
The full piece is here (pdf). This seems to me our best understanding of the admittedly limited data to date.
Upward mobility in the United States is not declining as many citizens think
Here is the new Raj Chetty paper that everyone is talking about (pdf);
We use administrative records on the incomes of more than 40 million children and their parents to describe three features of intergenerational mobility in the United States. First, we characterize the joint distribution of parent and child income at the national level. The conditional expectation of child income given parent income is linear in percentile ranks. On average, a 10 percentile increase in parent income is associated with a 3.4 percentile increase in a child’s income. Second, intergenerational mobility varies substantially across areas within the U.S. For example, the probability that a child reaches the top quintile of the national income distribution starting from a family in the bottom quintile is 4.4% in Charlotte but 12.9% in San Jose. Third, we explore the factors correlated with upward mobility. High mobility areas have (1) less residential segregation, (2) less income inequality, (3) better primary schools, (4) greater social capital, and (5) greater family stability. While our descriptive analysis does not identify the causal mechanisms that determine upward mobility, the new publicly available statistics on intergenerational mobility by area developed here can facilitate future research on such mechanisms.
Here is summary coverage from David Leonhardt. The highly reliable David starts with this: “The odds of moving up — or down — the income ladder in the United States have not changed appreciably in the last 20 years, according to a large new academic study that contradicts politicians in both parties who have claimed that income mobility is falling.”
Confusing issues of equality and mobility remains rife in current discourse.
Income inequality is not as extreme as many citizens think
Here is a recent Gallup poll of interest, suggesting many people are unhappy with the level of income inequality. Alternatively, here is a new paper to warm Bryan Caplan’s heart, by John R. Chambers, Lawton K. Swan, and Martin Heesacker, entitled “Better Off Than We Know: Distorted Perceptions of Incomes and Income Inequality in America”:
Three studies examined Americans’ perceptions of incomes and income inequality using a variety of criterion measures. Contrary to recent findings indicating that Americans underestimate wealth inequality, we found that Americans not only overestimated the rise of income inequality over time, but also underestimated average incomes. Thus, economic conditions in America are more favorable than people seem to realize. Furthermore, ideological differences emerged in two of these studies, such that political liberals overestimated the rise of inequality more than political conservatives. Implications of these findings for public policy debates and ideological disagreements are discussed.
There is this bit:
Most participants (76%) incorrectly selected the higher value ($681,649) as the cutoff for the top 1% of earners, magnifying the level of income it takes to qualify as a “1 percenter.”
There are different measures, but I think of 380k as the relevant cut-off point for the top one percent. Here is a useful Atlantic write-up of the piece. I cannot find an ungated version, can you?
I thank Veronique de Rugy and Scott Winship for relevant pointers.
How Many Homicides were there in 2010?
How many homicides were there in 2010 in the United States? Well, that’s easy. Let’s just do some Googling:
Between the smallest and largest figures there is a difference of 3,292 deaths or 25%!
The differences are striking but not entirely arbitrary or without explanation. I assume the second figure adds late additions to the 2010 data and so should be considered more authoritative but that is a relatively small difference.
The difference between 2 and 3 is puzzling and seems to be that the number in 2 is drawn from the Supplementary Homicide Report (SHR) statistics on victims while the larger figure is drawn from homicide reports in the UCR. Not all agencies collect the more detailed statistics in the SHR while the UCR is nearly complete. Thus the victim figure is smaller than the report figure (this doesn’t appear to conform exactly to where the data is supposed to be sourced but it’s what the FBI tells me). It’s unclear why the FBI would report both figures when they know one is misleading.
The difference between 3 and 4 comes from different definitions of homicide. The FBI collects data on crimes. If a killing is ruled justified, i.e. not a crime, it doesn’t go into the FBI homicide statistics. The CDC collects data from death certificates which list as homicide any death caused by “injuries inflicted by another person with intent to injure or kill, by any means.” Thus, the CDC data includes justifiable homicide. In 2010 according to the FBI there were 387 justifiable homicides by law enforcement and 278 by private citizen for a total of 665 justifiable homicides, so that accounts for some but not all of the difference.
(By the way, the 278 justifiable homicides in 2010 by private citizens compared to 387 by law enforcement and 14,720 unjustifiable homicides would seem to be an important context for many claims about stand your ground laws. N.b. this doesn’t mean that the laws couldn’t be associated with more unjustifiable homicides).
The FBI (3) and NVSS (4) figures track each other closely over time but its important to be aware of the differences and to be consistent in one’s calculations.
Traffic Forecasts
Official DOT forecasts of road traffic with actual road traffic.
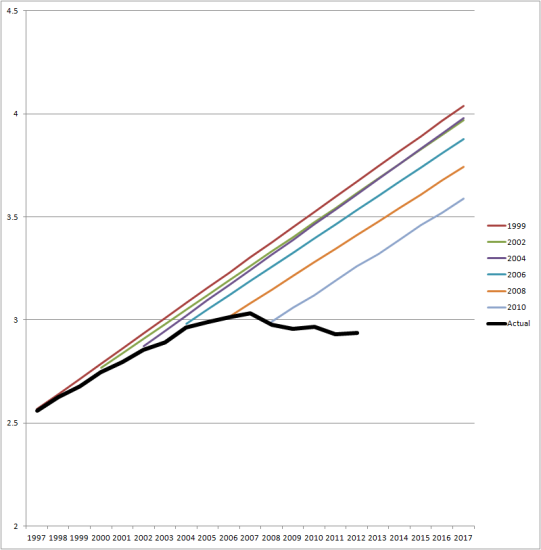
Hat tip to Andrew Gelman, who compares it with some other famous forecasts.
Teen employment and the minimum wage: sixty years of experience
Kevin Erdmann relates:
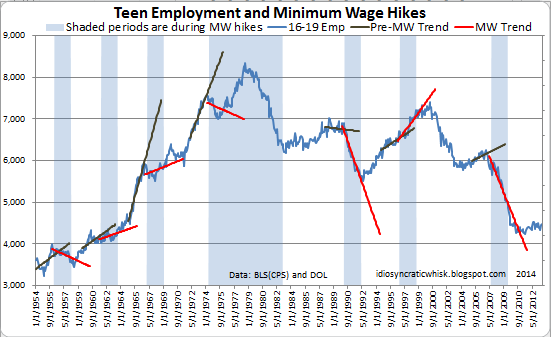
There is much more here. Kevin concludes: “Is there any other issue where the data conforms so strongly to basic economic intuition, and yet is widely written off as a coincidence?”