Category: Data Source
Houston versus California
In my Econ Talk with Russ Roberts on private cities I said this about Houston:
If we think about, what are the best cities in the United States, particularly for the poor, it’s places like Houston, which have no zoning and which have very easy regulatory systems in which you can build. You can get a permit to build within a matter of days, compared to New York where you’ve got to go through a dozen different permitting processes and you have to hire specialized people whose only job is really to stand in line to help you get through the process….So, people of modest means can still buy a house in Houston. And they can’t do that in many other places in the United States because of zoning and not-in-my-backyard rules, a kind of secession of the rich, not in terms of gated communities but in terms of adding on rules and restrictions on how large your lot has to be in order to build a house, how many people can live in the house etc. All of these things have made it extremely expensive to buy in any of these cities, which use more top down planning.
The Economist illustrates with a remarkable statistic comparing Houston with all of California:
Unlike most other big cities in America, Houston has no zoning code, so it is quick to respond to demand for housing and office space. Last year authorities in the Houston metropolitan area, with a population of 6.2m, issued permits to build 64,000 homes. The entire state of California, with a population of 39m, issued just 83,000.
Did economic incentives destroy lower-income families?
That tale doesn’t seem to fit the data. DarwinCatholic reports:
There follows more hand-waving about how things are tough for those at the lower end of the economy. And they are. But here’s the problem. They always have been. The effect that we’re looking to explain is a massive decrease in marriage rates and increase in out-of-wedlock childbearing. If we’re going to explain that as driven by a bad economy, we’d expect to see the incomes of those people getting worse, right? But they haven’t.
There has been a near stagnation for the lowest quintile, but not general income declines. And if I understand the author correctly those figures do not include government benefits, and it is widely admitted that the “war on poverty” has brought some successful results. Or try this:
Since 1960 the out-of-wedlock birth rate for African Americans has increased by about 3.5x while the rate for Whites has increased by 10x. If you look at median incomes by race via the Census, you’ll see that inflation adjusted median income for African American men has gone up by 82% from 1960 to 2001, while for white men it’s only gone up by 35% (for women those numbers are 272% and 135% respectively.) This does have a certain inverse relation to what we see on out-of-wedlock births, in that white out of wedlock births have increased more, but again we have the problem that incomes have in fact gone up, while marriage and the family have clearly gone down.
Maybe “cultural factors” do play a role and it is not all about wages and the economics. In passing, here is your “Jordan fact of the day”:
The US shows up low on the list, while right at the top with 94% percent of children living with two parents is that well known northern European social democracy… Jordan.
The post is excellent and interesting throughout. For the pointer I thank Will. In the meantime, score one for David Brooks.
What cost is each state obsessed with?

Or click here for a larger map and further explanation. The data are taken from Google searches from each state, and sadly the Northeast does not surprise me. (You will note that the searches seem to be done for the capital city of each state, which is selecting somewhat for low quality.) Perhaps Kentucky, Washington state, and Minnesota come off looking best…
For the pointer I thank Yuka.
United States facts of the day
Joe Uva, chairman of Hispanic enterprises and content at NBCUniversal, a big media company, is fond of telling fellow executives that with a combined purchasing power of $1.1 trillion, if Hispanic-Americans were a country they would rank 16th in the world.
That is from The Economist, via Rami Kiwan. I would amend this by noting I am not aware of any very exact calculation of the purchasing power of Hispanic-Americans, so there is perhaps a bit of a caveat emptor here, still as a ballpark estimate this seems reasonable. There is this too:
A giant reason to be optimistic about the rise of Hispanics is that they are making America much younger. The median age of whites is 42; of blacks 32; and of Hispanics 28. Among American-born Hispanics, the median age is a stunning 18.
The article is interesting more generally.
New html edition of Tyler Cowen’s ethnic dining guide is up
You will find it here on my home page, scroll way down. You should note it is more or less a copy of the blog version of the dining guide and does not contain new information if you have been following the blog. Among the new and exciting places are Saudi food, Nanjing-style Chinese food, and I hear Peter Chang is opening his new Arlington place this coming Saturday.
Japan fact of the day
Japan’s nominal [correction: real] gdp growth for 2014 turns out to be about…zero.
The primary source is here, via Ben MacLannahan.
How happy are academic economists?
Lars P. Feld, Sarah Necker, and Bruno S. Frey have done some new research on this question, I would say this is good news for us, and bad news for many of you, though apparently you are clawing back some of what you gave to us:
We study the importance of economists’ professional situation toward their life satisfaction based on a unique survey of mostly academic economists. On average, economists report to be highly happy with life. Satisfaction is positively related to spending more time on doing research. The lack of a tenured position decreases satisfaction. However, the extent to which the uncertainty created by the tenure system affects satisfaction varies with the contract terms. The effect is stronger if the contract expires in the near future or cannot be extended. Publication success has no effect if it is controlled for academic rank and the contract duration. The finding suggests that publications are rather a means to an end, e.g., to acquire a tenured position. While the perceived level of external pressure also has no impact, the perceived change of pressure in recent years is positively related to economists’ life satisfaction. An explanation is that economists have accepted a high level of pressure when entering academia but are not willing to cope with the recent increase.
The SSRN link is here, via www.bookforum.com.
United States fact of the day
Percentage of annual net electricity generation by renewables in 1948: 32
Percentage of annual net electricity generation by renewables in 2005: 11
The main difference of course is the fall in the relative import of hydroelectric power.
By the way, those numbers are read off a graph and thus are approximate. They are from p.67 of Mara Prentiss, Energy Revolution: The Physics and the Promise of Efficient Technology, new and noteworthy from The Belknap Press of Harvard University Press, recommended.
Ms. Schneider’s China estimate of the day
Ms Schneider reckons that more than half of the world’s feed crops will soon be eaten by Chinese pigs.
That is from The Economist, via Scott Sumner, whose post is of interest more generally on numerous matters. Scott also cites The Economist for telling us that in China smaller cities are more densely populated than larger cities.
Greece tax evasion fact of the day
More than 100% of the self-reported income of Greece’s professional classes is going toward paying off consumer debts.
Facts about families
According to Eurostat, the European Union’s statistical agency, the probability of marriage before age 50 has been plummeting for European women and men, while the chance of divorce for those who do marry has been soaring. In Belgium—the birth-land of the scholars who initially detected this Second Transition—the likelihood of a first marriage for a woman of reproductive age is now down to 40%, and the likelihood of divorce is over 50%. This means that in Belgium the odds of getting married and staying married are under one in five. A number of other European countries have similar or even lower odds.
Europe has also seen a surge in “child-free” adults—voluntary childlessness. The proportion of childless 40-something women is one in five for Sweden and Switzerland, and one in four for Italy. In Berlin and in the German city-state of Hamburg, it’s nearly one in three, and rising swiftly. Europe’s most rapidly growing family type is the one-person household: the home not only child-free, but partner- and relative-free as well. In Western Europe, nearly one home in three (32%) is already a one-person unit, while in autonomy-prizing Denmark the number exceeds 45%. The rise of the one-person home coincides with population aging. But it is not primarily driven by the graying of European society, at least thus far: Over twice as many Danes under 65 are living alone as those over 65.
…Given recent trajectories, demographers Miho Iwasawa and Ryuichi Kaneko project that a Japanese woman born in 1990 stands less than even odds of getting married and staying married to age 50.
That is from Nicholas Eberstadt, hat tip goes to Philip Wallach.
Hong Kong fact and projection of the day
Hong Kong is a tough marriage market for women because of the city’s skewed gender ratio — 876 males for every 1,000 females, a gap predicted to worsen to 712 to 1,000 by 2041.
That is from Julie Zhu at the FT.
The decline in on-the-job training
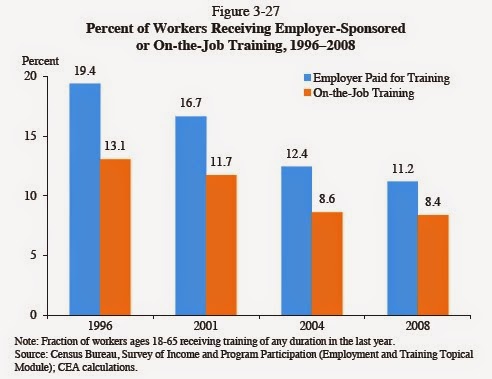
That is from Timothy Taylor, who remains a model of excellence and lucidity.
Economic freedom and the size of government, or does paying taxes boost freedom?
That is a new and provocative paper by James Edward Mahon Jr. of Williams College, the abstract is here:
This paper explores the relationship between government size and economic freedom, relating these patterns to theories of fiscal politics. In order to address current political controversies, it uses data on pre-1990 OECD members (minus Norway) for central government tax revenues and spending, as well as indicators of economic freedom derived from the Fraser Institute, ICRG, Heritage Foundation, and the World Bank. It finds that it matters a great deal whether we define size as expenditures or taxation. Spending has no relationship with freedom, or a negative one, across this data set. Initial tax revenue levels, however, positively predict subsequent changes in economic freedom. We find similar patterns using different measures of economic freedom and whether we use annual data (1995-2010) or overlapping six-year averages going back to 1970-75. These results challenge the common preconception that taxes and economic freedom are negatively related. In addition, the divergence between tax revenue and spending in this regard is more consistent with a “fiscal contract” model of the state, in which taxation and economic freedom go together, as governments attend to their legitimacy and the health of the private sector in order to increase revenue, but flag in these efforts when they enjoy sources of income other than taxes.
For the pointer I thank the excellent Kevin Lewis.
The preference for potential
Here is a piece by Tomala, Jia, and Norton:
When people seek to impress others, they often do so by highlighting individual achievements. Despite the intuitive appeal of this strategy, we demonstrate that people often prefer potential rather than achievement when evaluating others. Indeed, compared with references to achievement (e.g., “this person has won an award for his work”), references to potential (e.g., “this person could win an award for his work”) appear to stimulate greater interest and processing, which can translate into more favorable reactions. This tendency creates a phenomenon whereby the potential to be good at something can be preferred over actually being good at that very same thing. We document this preference for potential in laboratory and field experiments, using targets ranging from athletes to comedians to graduate school applicants and measures ranging from salary allocations to online ad clicks to admission decisions.
Here are some ungated copies. For the pointer I thank the excellent Kevin Lewis, who sent me the link in response to my earlier post on age discrimination.