Category: Data Source
How a genre of music affects life expectancy of famous musicians in that genre
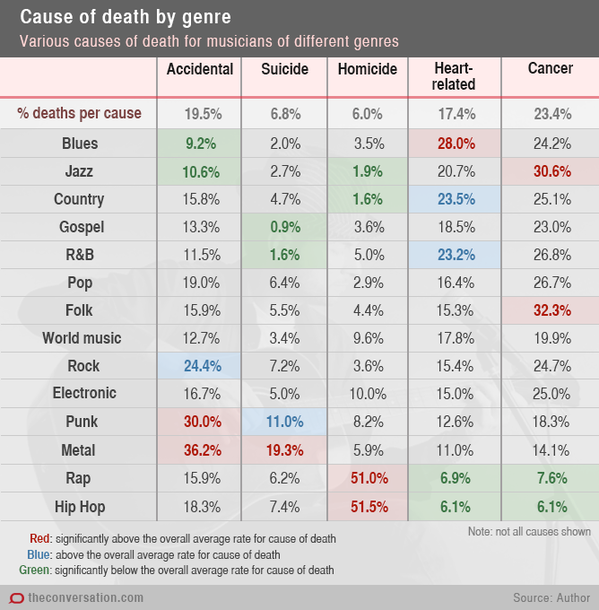
That is from Dianne Theodora Kenny, via Ted Gioia. Kenny notes:
For male musicians across all genres, accidental death (including all vehicular incidents and accidental overdose) accounted for almost 20% of all deaths. But accidental death for rock musicians was higher than this (24.4%) and for metal musicians higher still (36.2%).
Suicide accounted for almost 7% of all deaths in the total sample. However, for punk musicians, suicide accounted for 11% of deaths; for metal musicians, a staggering 19.3%. At just 0.9%, gospel musicians had the lowest suicide rate of all the genres studied.
Murder accounted for 6.0% of deaths across the sample, but was the cause of 51% of deaths in rap musicians and 51.5% of deaths for hip hop musicians, to date.
Beware selection, because of course most rap musicians aren’t dead yet. This problem will be more extreme, the younger is the genre. Another selection effect may be that getting killed, or dying in an unusual way, contributes to your fame.
How much has the introduction of air conditioning driven interstate mobility?
Paul Krugman has had a few posts on this question, most recently this one, the first one here. Krugman is right in asserting a major role for air conditioning, but there is a subtle framing point which is sometimes neglected. The most on-point study is this piece from Jordan Rappaport (pdf):
U.S. residents have been moving en masse to places with nice weather. Well known is the migration towards places with warm winters, which is often attributed to the introduction of air conditioning. But people have also been moving to places with cooler, less-humid summers, which is the opposite of what is expected from the introduction of air conditioning. Nor can the movement to nice weather be primarily explained by shifting industrial composition or by elderly migration. Instead, a large portion of weather-related moves appear to be the result of an increased valuation of nice weather as a consumption amenity, probably due to broad-based rising per capita income.
Overall Rappaport concludes that “nice [warm] weather is a normal good” is the more important driving force behind the movement to the Sun Belt than is air conditioning per se, though of course air conditioning makes nice warm weather all the nicer. Evidence from compensating differentials also indicates that “…the decreased discomfort from heat and humidity afforded by air-conditioning has not been the primary driver of the move to nice weather.” (p.26)
From 1880 to 1910, Americans overall are moving to places with bad (cold) weather. In the 1920s they start moving, on net, to places with nicer weather and that trend has not let up. The arrival of affordable air conditioning in the postwar era bumps this up a bit, but the main trend already was in place. Furthermore air conditioning has been in the south for quite a while now, but migration in that direction continues. In his second post on the topic, Krugman refers to this as a “gradual adjustment” to AC, but it seems to better fit the nice weather as a normal good story. We’ll know more if we see this migration continuing, but I expect it will. At some point it won’t be plausible to call the ongoing movement a “lagged response” to the introduction of air conditioning, but again it will fit the normal good story pretty smoothly.
Note also that life expectancy is notably higher in warm weather than cold weather. Deschenes and Moretti conclude (pdf): “…The longevity gains associated with mobility from the Northeast to the Southwest account for 4% to 7% of the total gains in life expectancy experienced by the U.S. population over the past thirty years.”
That again points toward a “normal good” explanation, with air conditioning playing a supporting role.
That all said, if you look at the larger political debate going on here, Krugman is correct in arguing that lower taxes are the not main reason for this migration, even though the median voter in these states probably approves of such relatively low tax rates. In any case, there is a clearer and better version of the weather hypothesis which can be put forward.
Addendum: David Beckworth adds commentary and some fascinating maps.
How has the language of World Bank reports changed?
From The New Left Review, Moretti and Pestre report:
Three new semantic clusters characterize the language of the Bank from the early 1990s on. The first—and most important—has to do with finance: here, alongside a few predictable adjectives (financial, fiscal, economic) and nouns (loans, investment, growth, interest, lending, debt), we find a landslide of fair value, portfolio, derivative, accrual, guarantees, losses, accounting, assets; a little further down the list, equity, hedging, liquidity, liabilities, creditworthiness, default, swaps, clients, deficit, replenishment, repurchase, cash. In terms of frequency and semantic density, this cluster can only be compared to the material infrastructures of the 1950s–60s; now, however, work in agriculture and industry has been replaced by an overwhelming predominance of financial activities.
…The second cluster has to do with management—a noun that, in absolute terms, is the second most frequent of the last decade (lower than loans, but higher than risk and investment!). In the world of ‘management’, people have goals and agendas; faced with opportunities, challenges and critical situations, they elaborate strategies. To appreciate the novelty, let’s recall that, in the 1950s–60s, issues were studied by experts who surveyed and conducted missions, published reports, assisted, advised and suggested programmes. With the advent of management, the centre of gravity shifts towards focusing, strengthening and implementing; one must monitor, control, audit, rate (Figure 2); ensure that everything is done properly while also helping people to learn from mistakes. The many tools at the manager’s disposal (indicators, instruments, knowledge, expertise, research) enhance effectiveness, efficiency, performance, competitiveness and—it goes without saying—promote innovation.
The concept of governance is another clear winner in more recent times, and furthermore the reports seem to overuse the word “and” relative to the word “the.” That I can believe. The article is interesting throughout, hat tip goes to Avinash Celstine.
The reallocation of talent in the American economy
At the Massachusetts Institute of Technology, a premier source of young recruits, only 9.9 percent of undergraduates went into finance in 2013, compared with the 31 percent that took jobs on Wall Street in 2006, before the financial crisis. Software companies, meanwhile, hired 28.1 percent of M.I.T. graduates in 2013, compared with 10.5 percent in 2006.
That is from Popper and Dougherty in the NYT, via Binyamin Appelbaum.
The under-representation of women in the movies and on TV
Will Radford and Mathias Gallé have a new and interesting paper on this topic, here is one excerpt:
Law and corporate professions had around 15% of female representation…the medical domain (doctors) had a female probability of 0.23…Religion does not score at the bottom with regards to female presentation (although very low with 0.08). From the professions we selected, Engineering was the lowest (0.05). The highest scoring profession was IT (0.52), which is partly due to the fact that many computer voices were female (computer had 460 female occurrences, versus 247 male ones; and enterprise computer from “Star Trek” was almost exclusively female)
By the way, the number of female writers and directors (in their IMDB database) was at a six year low in 2014.
If you look at most frequent roles for gender, women are assigned hostess, girl, woman, waitress, and mother. For men, the list swings toward narrator, announcer, doctor, detective, bartender, soldier, and police officer.
In 1980-200, the top “newly popular” role (for both sexes) was “additional voices.” For the time period 2000-present it was “zombie,” next was “housemate.”
The paper is here (pdf), hat tip goes to Samir Varma.
Here is a new and interesting article on whether there is greater female influence over cinematic box office these days.
How nepotistic are we?
In just about every field I looked at, having a successful parent makes you way more likely to be a big success, but the advantage is much smaller than it is at the top of politics.
Using the same methodology, I estimate that the son of an N.B.A. player has about a one in 45 chance of becoming an N.B.A. player. Since there are far more N.B.A. slots than Senate slots, this is only about an 800-fold edge.
Think about the N.B.A. further. The skills necessary to be a basketball player, especially height, are highly hereditary. But the N.B.A. is a meritocracy, with your performance easy to evaluate. If you do not play well, you will be cut, even if the team is the New York Knicks and your name is Patrick Ewing Jr. Father-son correlation in the N.B.A. is only one-eleventh as high as it is in the Senate.
Emphasis added by me. And this:
An American male is 4,582 times more likely to become an Army general if his father was one; 1,895 times more likely to become a famous C.E.O.; 1,639 times more likely to win a Pulitzer Prize; 1,497 times more likely to win a Grammy; and 1,361 times more likely to win an Academy Award. Those are pretty decent odds, but they do not come close to the 8,500 times more likely a senator’s son is to find himself chatting with John McCain or Dianne Feinstein in the Senate cloakroom.
That is all from Seth Stephens-Davidowitz.
The stagnation of Los Angeles fact of the day
There are just 6 per cent more people working in greater Los Angeles than there were 25 years ago. By contrast, the Inland Empire has nearly doubled in size. In fact, the absolute number of jobs added in the Inland Empire since 1990 is nearly double the absolute number of jobs added in greater LA. To get a sense of how wild that is, the entire workforce of the Inland Empire was only 13 per cent the size of Los Angeles’s back in 1990. Even now, there are more than three workers in Los Angeles for every one in the Inland Empire.
It’s a little hard to see given the scale of the chart, but it’s also worth noting that LA experienced a Depression-level drop in employment in the early 1990s. Between January, 1990 and November, 1993, employment in the America’s second-biggest metro area fell by nearly 11 per cent. Employment didn’t return to its previous peak until July, 1999. Talk about a lost decade! (It may help explain this.)
That is from Matthew C. Klein, there is more here, about other American cities too, possibly FT-gated but interesting throughout.
How good a marginal rebounder are you really?
Maybe this is too strange and squirrelly an example to deserve mention on MR, but I found it fascinating. It starts with this:
This year’s rebounding leaderboard, at least in terms of rebounds per game, is topped by DeAndre Jordan and Andre Drummond, who also finished 1-2 last season. In a bygone era, you’d simply say they are the league’s best rebounders at this time. Yet it might not be that way at all.
There seems to be a huge oops:
Both the Clippers and Pistons have better defensive rebound rates with their star rebounders on the bench. How is that possible?
This is a big topic, but one possible reason could be the simple fact that neither Jordan nor Drummond is particularly concerned with boxing out…Drummond blocks out on the defensive glass just 5.97 times per 100 opportunities, lowest in the league among centers with at least 500 chances.
Jordan is a little better at 9.64, but that’s still the 11th-lowest total.
In other words, what really matters is marginal rebounding prowess, adjusting for how many rebounds you take away from the other players on your team. Maybe an individual can pull in the ball more often by positioning himself to grab the low hanging fruit rebounds — often taking them from other team members — rather than boxing out the other team for the tough, contested rebounds.
Measurement really is changing the world. The article is here, by Bradford Doolittle, ESPN gated. Here is more on DeAndre Jordan, also ESPN gated. That is one media source I pay for gladly.
The new economic history of Africa
This 2010 piece looks very interesting, I haven’t had the chance to read it yet, source here.
Matt Rognlie on Piketty, net capital returns, and housing
Brookings emails me:
Capital income is not growing unboundedly at the expense of labor, and further accumulation of capital in fact most likely means a fall in capital’s share of total income – refuting one of the main theories of economist Thomas Piketty’s popular book Capital in the 21st Century — according to a paper presented today at the Spring 2015 Conference on the Brookings Papers on Economic Activity (BPEA).
Existing studies that show an increase in capital’s share of income miss the growing role of depreciation in short-lived capital, in items such as software, says MIT’s Matthew Rognlie in “Deciphering the Fall and Rise in the Net Capital Share.” Rognlie subtracts depreciation in seven large developed economies (the US, Japan, Germany, France, the UK, Italy, and Canada) to get net capital income, and finds that the only long-term rise in capital’s share of income is in housing. Capital income elsewhere in the economy has grown moderately, but it is only recovering from a large fall that lasted from 1948 through the 1970s.
Piketty’s Capital argues that the role of capital in the economy, after falling during the Depression and two world wars, is set to recover to the high levels of the 19th and early 20th centuries. According to Piketty, wealth will accumulate amid slowing economic growth to push up the capital-to-GDP ratio in the economy, which will then cause an increase in capital’s share of income — and growing inequality.
In contrast, Rognlie finds that a rising capital-to-GDP ratio is most likely to result in a fall in capital’s share of income, since the net rate of return on capital will fall by an even larger proportion than the capital-to-GDP ratio rises. Outside of housing, postwar changes in the value of the capital stock have not led to parallel changes in capital’s share of income. In fact, the value of the capital stock relative to private income reached its highs in the late 1970s and early 1980s, when capital’s share of income was near a low.
Rognlie shows that the share of net income generated by housing has risen in all seven large developed economies since data became available. “Housing’s central role in the long-term behavior of the aggregate net capital share has… not been emphasized elsewhere…Observers concerned about the distribution of income should keep an eye on housing costs,” he writes.
Brad DeLong offers comment.
Here Jim Tankersley has a superb profile of Rognlie and the story behind his comment, MR plays a role too. Recommended.
The missing men of Ferguson
An important but unreported indicator of Ferguson’s dilemma is that half of young African American men are missing from the community. According to the U.S. Census Bureau, while there are 1,182 African American women between the ages of 25 and 34 living in Ferguson, there are only 577 African American men in this age group. In other words there are more than two young black women for each young black man in Ferguson. The problem of missing black men extends to other age groups. More than 40% of black men in both the 20 to 24 and 35 to 54 age groups in Ferguson are missing.
It is worth noting that there are approximately equal numbers of African American boys and girls, under the age of 20, in Ferguson (2,332 boys and 2,341 girls). What has happened to young African American men in Ferguson? There are several possibilities. First, the Census counts only the civilian population, and excludes individuals serving in the Armed Forces. Second, tragically, some of these young men have already died. Third, Census figures do not include individuals who are incarcerated at the time of the survey. Finally, the Census Bureau may undercount homeless men, men who are marginally attached to the community, and men who are primarily engaged in criminal behavior.
That is from Stephen Broners, fascinating throughout. Note that the possibility of differential rates of incarceration does not in general account for the gap, though it likely explains part of the discrepancy.
When is Uber cheaper than a taxi?
Uber appears more expensive for prices below 35 dollars and begins to become cheaper only after that threshold,” say Mascolo and co.
That is for New York City and the data set appears pretty impressive. The article is here, the original research here, and for the pointer I thank Michelle Dawson.
Sentences to ponder
How much has the U.S. poverty rate declined?
Official percent poor in 1964: 19.0%
Official percent poor in 2013: 14.5%
Reduction to correct for:
Value of noncash benefits – 3.0%
Omission of refundable tax credits – 3.0%
Replacing CPI-U with PCE index – 3.7%
Adjusted percent poor in 2013: 4.8%
That is adapted from a Christopher Jencks review, “The War on Poverty: Was It Lost?”, in the 2 April 2015 New York Review of Books.
Do any of you know a good link-accessible version of comparable information? By the way, here is Ross Douthat on money and culture.
Houston versus California
In my Econ Talk with Russ Roberts on private cities I said this about Houston:
If we think about, what are the best cities in the United States, particularly for the poor, it’s places like Houston, which have no zoning and which have very easy regulatory systems in which you can build. You can get a permit to build within a matter of days, compared to New York where you’ve got to go through a dozen different permitting processes and you have to hire specialized people whose only job is really to stand in line to help you get through the process….So, people of modest means can still buy a house in Houston. And they can’t do that in many other places in the United States because of zoning and not-in-my-backyard rules, a kind of secession of the rich, not in terms of gated communities but in terms of adding on rules and restrictions on how large your lot has to be in order to build a house, how many people can live in the house etc. All of these things have made it extremely expensive to buy in any of these cities, which use more top down planning.
The Economist illustrates with a remarkable statistic comparing Houston with all of California:
Unlike most other big cities in America, Houston has no zoning code, so it is quick to respond to demand for housing and office space. Last year authorities in the Houston metropolitan area, with a population of 6.2m, issued permits to build 64,000 homes. The entire state of California, with a population of 39m, issued just 83,000.