Category: Data Source
Who is moving out of the U.S. labor force?
Read the recent testimony of Robert E. Hall (pdf):
Most of the decline in participation occurred among teenagers and young adults. The fi nding that these e ffects tend to be larger in more prosperous families points strongly away from much of a role for rising influence of benefi t programs, because these programs, especially food stamps, are only available to families with incomes well below the median.
A tale of two false estimates?
1. Toilet paper is shrinking, the size of the individual sheets that is. (That is probably the closest we will get to hyperinflation.) Does the average American really use 46 sheets a day? That sounds like an overstatement.
In contrast to this commodity, I usually want for food portion sizes — especially ice cream — to be downsized.
2. I say both men and women are understating their number of sexual partners. Contrary to what is portrayed in this chart, I postulate an American male average of about four. I do not agree with the common claim that American men will overstate their number of partners.
The pointer is via Rayman.
The Chinese money supply
Derek Scissors reports:
Broad money M2 breached $20tn at the end of December, a staggering 70 per cent larger than in the US, where monetary policy has hardly been tight.
There’s a tremendous amount of liquidity, the problem is no one is using it. Growth in narrow money M1 has collapsed. It was a dangerously excessive 32.4 per cent in 2009. It was a dangerously anemic 3.2 per cent in 2014.
M1 is money being held ready for use in anticipated transactions. It should correlate very well with GDP, which is a sum of transaction values. But while M1 flies around over time, GDP growth barely budges in comparison. It strains credulity that the amount of money held for use could grow at one-tenth the speed in 2014 as it did in 2009, yet growth in uses of that money (GDP) drops less than 2 points.
The FT post is of more interest generally on Chinese economic statistics.
Broadband Norwegian average is over
Here is the new paper by Akerman, Gaarder, and Mogstad on how Norwegian broadband access has helped the higher earners and largely hurt unskilled labor:
Does adoption of broadband internet in firms enhance labor productivity and increase wages? And is this technological change skill biased or factor neutral? We exploit rich Norwegian data to answer these questions. A public program with limited funding rolled out broadband access points, and provides plausibly exogenous variation in the availability and adoption of broadband internet in firms. Our results suggest that broadband internet improves (worsens) the labor outcomes and productivity of skilled (unskilled) workers. We explore several possible explanations for the skill complementarity of broadband internet. We find suggestive evidence that broadband adoption in firms complements skilled workers in executing nonroutine abstract tasks, and substitutes for unskilled workers in performing routine tasks. Taken together, our findings have important implications for the ongoing policy debate over government investment in broadband infrastructure to encourage productivity and wage growth.
The emphasis is added by this blogger, not from the authors.
Think Tank Bias in Political Donations
Tom VanAntwerp looks at political donations by the staff of the top-ten think tanks. Some findings:
Think tank employees overwhelmingly give to Democratic causes. Nearly 78% of all political contributions from think tank employees went to Democrats. 208 think tank employees gave a total of $452,589 to Democrats in 2012;
Discussions of bias via donor base don’t match actual employee partisanship.Comparing the most obviously ideological think tanks, employees of both Heritage Foundation and Center for American Progress gave vastly more to political groups than did employees of Cato Institute. While the Wikipedia discussion of Cato’s funders was over three times longer than the same discussion for either Heritage or CAP, only 3.5% of Cato’s employees made partisan donations compared to 8.7% for Heritage and 8.2% for CAP. The total amount Cato employees gave was also dwarfed by Heritage and CAP employees: $10,200 versus $76,653 and $100,747.
In another post, VanAntwerp shows that even though the staff at Cato don’t give very much to politicians and are not especially partisan by other think tank standards, media discussion’s of Cato’s funding and funders are far more common and extensive than that of any other think tank. My guess is that conservatives give Heritage a pass, liberals give Brookings, CAP, and Pew a pass but both liberals and conservatives are suspicious of Cato. Liberals think Cato is in bed with the corporations, conservatives think Cato is in bed with gays and marijuana users. Both sides think Cato is with the opposition and, as a result, Cato generates lots of media discussion about funding “bias.”

Were poor people to blame for the housing crisis?
When we break out the volume of mortgage origination from 2002 to 2006 by income deciles across the US population, we see that the distribution of mortgage debt is concentrated in middle and high income borrowers, not the poor. Middle and high income borrowers also contributed most significantly to the increase in defaults after 2007.
There is also this:
Poorer areas saw an expansion of credit mostly through the extensive margin, i.e. a larger numbers of mortgages originated, but at DTI levels in line with borrower income.
That is from the new NBER working paper by Adelino, Schoar, and Severino. In other words, poor people (or various ethnic groups, in some accounts) were not primarily at fault for the wave of mortgage defaults precipitating the financial crisis. The biggest problems came in zip codes where home prices were having large run-ups. Their conclusion is:
These results are consistent with an interpretation where house price expectations led lenders and buyers to buy into an unfolding bubble based on inflated asset values, rather than a change in the lending technology.
Changes in policy, of course, also for this context would count as “a change in the lending technology.”
Technology doesn’t always make you more stressed out
Here is a very interesting piece by Claire Cain Miller, here is one excerpt:
The Pew and Rutgers researchers measured stress levels in a representative group of people by using a standard stress scale that ranks people’s responses to questions about their lives. Then they measured their frequency of digital technology use. They controlled for demographic factors like marital and education status.
They found no effect on stress levels among technology users over all. And women who frequently use Twitter, email and photo-sharing apps scored 21 percent lower on the stress scale than those who did not.
That could be because sharing life events enhances well-being, social scientists say, and women tend to do it more than men both online and off. Technology seems to provide “a low-demand and easily accessible coping mechanism that is not experienced or taken advantage of by men,” the report said.
Social media, particularly Facebook, increased stress in one way: by making people more aware of trauma in the lives of close friends. This effect was strongest for women. The finding bolsters the notion that stress can be contagious, the Pew and Rutgers researchers said.
But when such users of social media were exposed to stressful events in the lives of people who were not close friends, the users reported lower stress levels. Researchers said that was perhaps attributable to gratitude for their own lives being free of these stressors (the joy of missing out, offsetting the fear of missing out.)
Do read the whole thing.
How judges, loan officers, and baseball umpires overcompensate for past decisions
The actual title is “Decision-Making under the Gambler’s Fallacy” (pdf) and the authors are daniel Chen, Tobias J. Moskowitz, and Kelly Shue. Here is one short bit from what is more generally a very interesting paper:
We test our hypothesis in three high-stakes settings: refugee court asylum decisions in the US, a field experiment by Cole et al. (2013) in which experienced loan officers in India review real small-business loan applications in an experimentally controlled environment, and umpire calls of pitches in Major League Baseball games. In each setting, we show that the ordering of cases is likely to be conditionally random. However, decisions are significantly negatively autocorrelated. We estimate that up to 5 percent of decisions are reversed due to the gambler’s fallacy.
To make that more concrete, if a baseball umpire first calls a ball, the next pitch he is more likely to then call a strike. Of course this may plague your paper refereeing decisions, whether or not you finish your next book, and your dating life.
The original pointer was from Cass Sunstein on Twitter.
How much do subsidies to community college attendance matter?
That is a new NBER Working Paper by Angrist, Autor, Hudson, and Pallais. Here is the sentence of interest for the recent community college initiative:
Awards offered to prospective community college students had little effect on college enrollment or the type of college attended.
Do note that some other kinds of awards appeared to be more effective, so this is not an anti-subsidy result per se. And here is a new Bulman and Hoxby paper on federal tax credits and the demand for higher education (not just community colleges):
We assess several explanations why the credits appear to have negligible causal effects.
Making these programs work is not so easy. Reihan Salam offers good points, so does Arnold Kling.
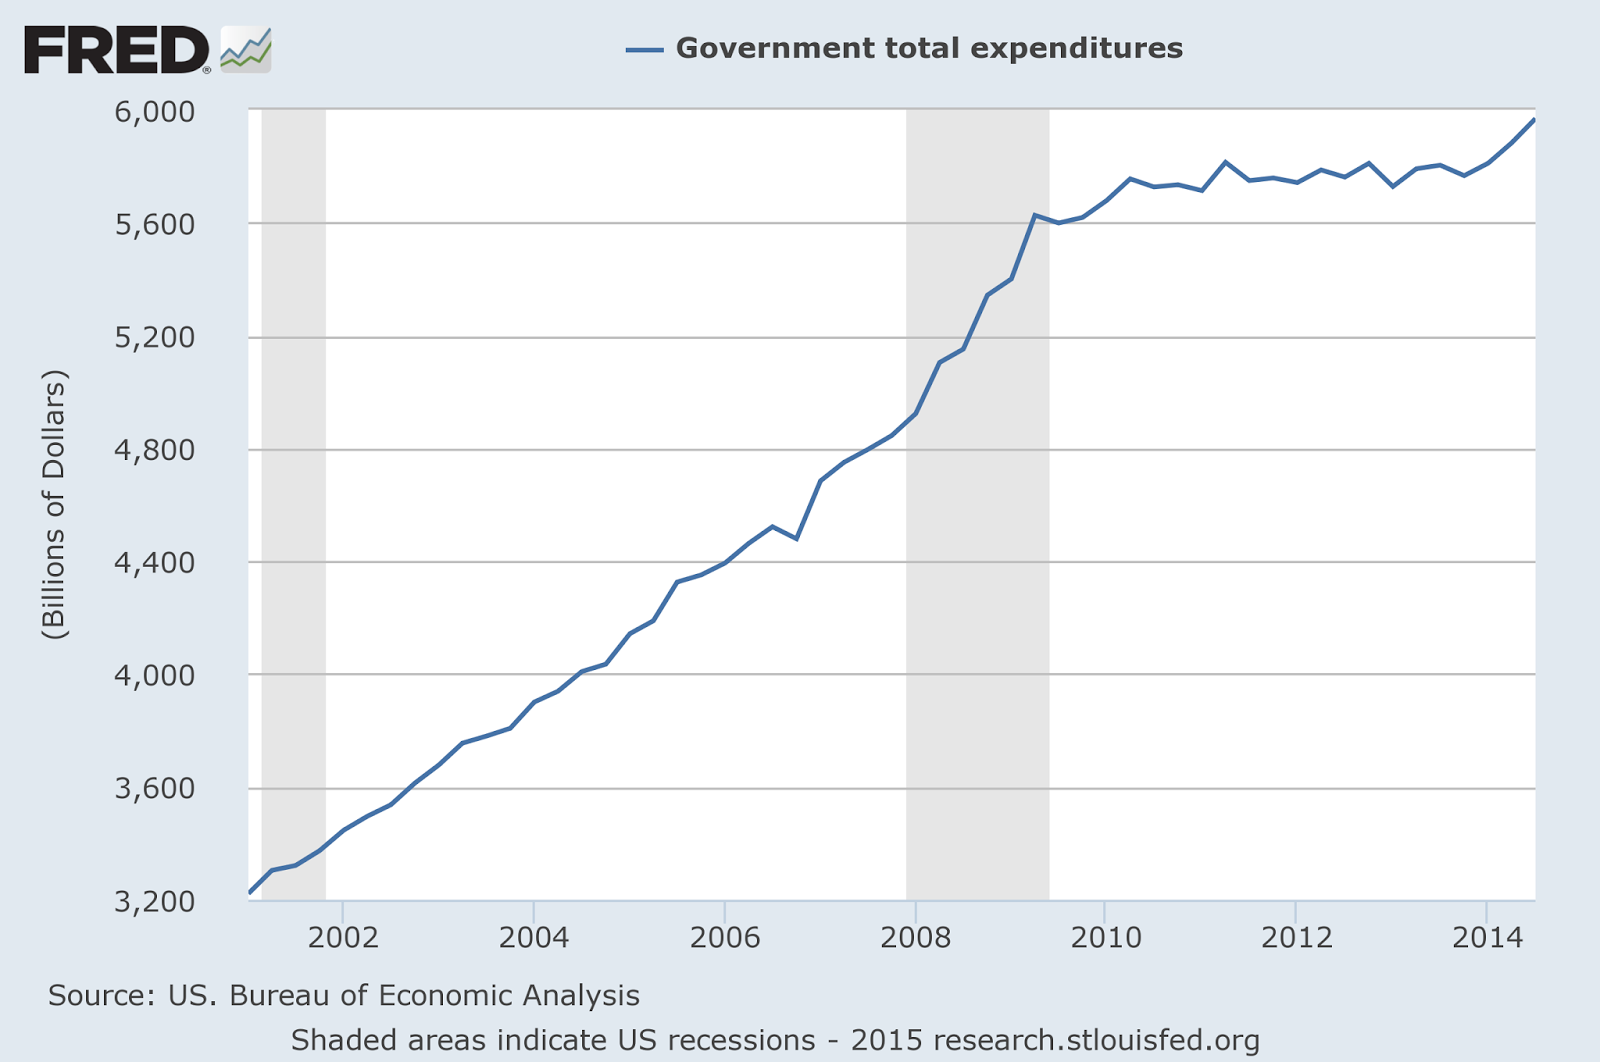
Angus on austerity (words of wisdom)
From this graph I concluded one of two things must be true depending on one’s definition of austerity.
Either austerity means nominal cuts and we never had any of it, or austerity means cuts relative to trend and we are still savagely in its grasp.
Relative to the 2000-2009 decade trend, total government spending is roughly 35% lower in q3 of 2014 than it should be. Hard to say austerity is over by that metric.
The full link is here. As I wrote in an email to an unnamed correspondent earlier today: “I gladly admit that reading me in 2006 was not a good guide for what happened in 2007-2008. A bunch of those guys should admit the same about the current day…”
In which professions are Americans most likely to be married?
Catherine Rampell reports:
While engineers, mathematicians and scientists today are (unfairly) stereotyped as awkward nerds who don’t know how to interact with the opposite sex, in 1950 they were among the occupations most likely to be married. Today, the most commonly conjugated occupations are instead more often medical professionals with doctorates, starting with dentists (81 percent of whom are hitched)…
The top of the list looks like this:
1) Dentist
2) Chief executive
3) Sales engineer
4) Physician
5) Podiatrist
6) Optometrist
7) Farm product buyer
8) Precision grinder
9) Religious worker
10) Tool and die maker
We also learn this:
Turns out that in 1950, many of the occupations whose members were most likely to end up divorced were creative or artistic ones (artist, writer/director, dancer, designer, writer), which perhaps reflects the communities that were most accepting of divorce at the time. In 2010, the occupations with the highest divorce rates were predominantly in manufacturing or other areas that have been subject to downsizing (drilling machine operator, knitter textile operative, force operator, winding machine operative, postal clerk). This seems to support the idea that economic stability is a good predictor of marital status.
Do read the whole thing.
There are nominal rigidities in Indian villages too
Supreet Kaur has a new NBER paper on this:
This paper tests for downward nominal wage rigidity in markets for casual daily agricultural labor in a developing country context. I examine transitory shifts in labor demand, generated by rainfall shocks, in 600 Indian districts from 1956-2009. First, there is asymmetric adjustment: nominal wages rise in response to positive shocks but do not fall during droughts. Second, transitory positive shocks generate ratcheting: after they have dissipated, nominal wages do not adjust back down. Third, inflation moderates these effects, enabling downward real wage adjustments both during droughts and after positive shocks. Fourth, wage distortions generate employment distortions, creating boom and bust cycles: employment is 9% lower in the year after a transitory positive shock than if the positive shock had not occurred. Fifth, consistent with the misallocation of labor across farms, households with small landholdings increase labor supply to their own farms when they are rationed out of the external labor market. The results are not consistent with other transmission mechanisms, such as migration or capital accumulation. These findings indicate the presence of rigidities in a setting with few institutional constraints. Survey evidence suggests that workers and employers believe that nominal wage cuts are unfair and lead to effort reductions.
There are ungated versions here. I am often puzzled, by the way, that we do not spend much more time studying nominal rigidities, which are the source of rather considerable deadweight losses. We do not find nominal rigidities everywhere. Salespeople working on commission often have flexible wages, as do (some) people working in high-trust, high morale organizations. What exactly accounts for these differences and how much can they be replicated? What are their psychological costs? Are there personality types which can deal with nominal flexibility of wages and types who cannot? How frequent is one type relative to the other? How do the psychological costs of a wage cut compare to the psychological costs of suffering losses when running your own business? Questions such as these should be much higher on the list of research priorities.
Who are the most influential economists?
Everyone is up in arms over the list supplied by The Economist. I won’t go through those debates. Let me just note that for all the talk of wonk this, data that, and Generalized Method of Moments this that and the other, every now and then the best algorithm is simply Asking Tyler Cowen. So here are, in no particular order, the most influential economists circa 2014:
1. Thomas Piketty
2. Paul Krugman
3. Joseph Stiglitz
4. Jeffrey Sachs
5. Amartya Sen
Basta. Of course Yellen and Draghi are extremely influential as central bankers, but in the way Paul Volcker was, so that is a different list, albeit a more important one.
I would add several comments:
a. Piketty does very very well for marginal impact in 2014, but probably would/will do less well over broader time spans, even if you think his work will hold up.
b. Krugman is a clear winner for the United States.
c. Stiglitz, Sachs, and Sen have most of their influence outside of the United States.
d. Larry Summers is influential among economists and the intelligentsia and is one possible choice for number six, with Dani Rodrik as another, or maybe drum up the leading Islamic theorist on sukuk. But Summers is not so influential with casual observers, which in some ways puts him as the opposite of Stiglitz (in his current incarnation).
e. There is no right-wing or center-right economist on the list. See the EJW symposium on why there is no Milton Friedman today. Krugman is probably the most politically conservative figure among the top five.
f. Behavioral economics as a whole is quite influential, but with no single dominant figure of influence. In actuality Cass Sunstein (not formally an economist) and Richard Thaler might globally be #1 in the behavioral area, followed by Daniel Kahneman.
Testing peer review by running submissions through the process twice
In particular, about 57% of the papers accepted by the first committee were rejected by the second one and vice versa. In other words, most papers at NIPS would be rejected if one reran the conference review process (with a 95% confidence interval of 40-75%)
Here is another framing:
If the committees were purely random, at a 22.5% acceptance rate they would disagree on 77.5% of their acceptance lists on average.
That is from Eric Price on the NIPS experiment, there is more here.
For the pointer I thank a loyal MR reader.
Geoengineering
David Keith, a climate scientist at Harvard University, and author of A Case for Climate Engineering, is interviewed at re/code.
There’s no question it reduces the global average temperatures; even the people who hate it agree you could reduce average global temperatures. The question is: How does it do on a regional basis?
By far the single most important thing to look at on a region-by-region basis is the impact on rainfall and temperature.
And the answer is, it works a lot better than I expected. It’s really stunning.
A lot of us thought that, in fact, geoengineering would do a lousy job on a regional basis — and there’s lots of talk on the inequalities — but in fact, when you actually look at the climate models, the results show they’re strikingly even.
Now, it’s not perfect and there are some things it won’t do. Turning down the sun does nothing for ocean acidification.
But it looks like it can cut, like, 80 percent of the total variation in climate, which is really stunning.
In some ways we should be singing it from the rooftops. But the scientific community is so painfully scared of talking about it. These papers come out, and people find the best ways to say, well, it sort of works, but it’s really awful.
The fact is, people really appear to have found a way to significantly reduce the climate risk — by more than half, which is a big deal.
Hat tip: Mark Frazier.