Category: Data Source
Arnold Kling’s bad demographic news for libertarians
Arnold’s post is this:
Married households with children were 40.3% of all US households in 1970; in 2012, that share had fallen by more than half to 19.6%. Interestingly, the share of households that were married without children has stayed at about 30%. Other Family Households, usually meaning single-parent families with children, has risen.
I am afraid that the number of households married to the state has soared.”
Another way to put this is that we are consuming more of potential gdp in the form of not being around those we do not wish to be around. This is a kind of extreme individualism in the personality-based sense, though not in the political sense.
Net immigration into the UK, recent trends
This picture clarifies a few neglected points:
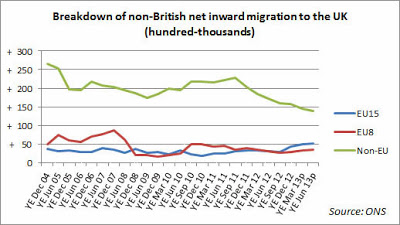
Since 2010 there has been a marked decline in non-EU net immigration. As a proportion of non-British immigration to the UK, it has dropped from 73% in June 2010 to 57% in June 2013. In the last year alone, it has fallen from 172,000 to 140,000.
Meanwhile, this year, net migration from the EU has gone up by 72,000 to 106,000.
But, as the chart above shows, the recent increase in net EU migration has come from the older, more established (and traditionally more wealthy) EU member states (the EU15), not the new member states from central and eastern Europe that joined in 2004 (the EU8).
That is from Open Europe Blog.
Which characteristics of economics departments predict productivity of publications?
In some recent work, Bosquet and Combes look at French data (only) and correlate the quality of economics departments with some of their underlying features. Why did they chose France?: “The most frequent way of becoming a full professor is via a national contest that allocates winners to departments in a largely random way.”
So what do we learn? First, large departments are in per capita terms not so much more productive and not at all doing better in terms of quality. Proximity to other economics departments also does not matter.
And then:
Heterogeneity among researchers in terms of publication performance has a large, negative explanatory power.
I suspect some of this is causal. It is good for departments to get rid of their dead wood and good when departments insist that everyone produce.
There is also this:
The second department characteristic that has the highest explanatory power of individual publication performance is the diversity of the department in terms of research fields (within economics).
I wonder there how much the allocation of researchers is truly random. I find the reverse causality story more plausible, namely that the strongest departments have the resources and heft to cover a larger number of fields, as it is less likely that having people scattered across many fields makes the department as a whole more productive.
In your spare time, you might also ponder this:
Finally, other department characteristics have interesting properties.
-
Contrary to common intuition, more students per academic do not reduce publication performance.
-
Women, older academics, stars in the department and co-authors in foreign institutions all have a positive externality impact on each academic’s individual outcome.
For the pointer I thank Mills Kelly.
A new RCT study of preschool
From Grover J. “Russ” Whitehurst:
I see these findings as devastating for advocates of the expansion of state pre-k programs. This is the first large scale randomized trial of a present-day state pre-k program. Its methodology soundly trumps the quasi-experimental approaches that have heretofore been the only source of data on which to infer the impact of these programs. And its results align almost perfectly with those of the Head Start Impact Study, the only other large randomized trial that examines the longitudinal effects of having attended a public pre-k program. Based on what we have learned from these studies, the most defensible conclusion is that these statewide programs are not working to meaningfully increase the academic achievement or social/emotional skills and dispositions of children from low-income families.
There is much more at the link at the Brookings blog, including the major details of the Vanderbilt study, with some very useful pictures. For the pointer I thank Michelle Dawson.
Claims about France
From Henry Samuel, reporting some claims by Jean-Philippe Delsol:
More than half of the active French population is living off the state, according to figures in a new book by a tax lawyer seeking to explain why so many of his clients in private enterprise are leaving France.
With the country on the brink of nationwide tax revolt, Why I’m Going to Leave France, published this week, has thrown more fuel on the fire by suggesting that 14.5 million people out of the country’s 28 million-strong workforce are — one way or another— making a living off taxpayers’ money. To reach the figure, the author begins with France’s or civil servants, of which there are 5.2 million and whose number has increased by 36% since 1983. These represent 22% of the workforce compared with a European average of 15%, leading him to conclude that France has 1.5 million too many “fonctionnaires”.
He then adds the 3.2 million unemployed people in France relying on state benefits, another 1.3 million taking low-income handouts, a further two million in the “parapublic” sector — majority state-owned companies — and more than a million people in state-funded associations such as charities. Under the current Socialist government, there are 750,000 state-subsidized jobs and the author includes a million people in the agricultural sector who rely largely on contributions from European Common Agricultural Policy subsidies.
He said that the figures in his book were only logical. “When you consider that public spending in France now accounts for 57% of gross domestic product, it’s only natural that more than half of the active workforce are paid with public money,” Mr Delsol told The Daily Telegraph.
A simple theoretical first cut at these numbers suggests they bring greater cyclical stability in the short run, inferior growth over time.
For the pointer I thank the excellent MacroDigest.
England fact of the day
From Sarah O’Connor and Chris Giles, this one is a bruiser:
The earnings of recent English graduates have deteriorated so rapidly since the financial crisis that the latest class is earning 12 per cent less than their pre-crash counterparts at the same stage in their careers. They also owe about 60 per cent more in student debt.
As Britain starts to emerge from the downturn, a Financial Times analysis of student loan data exposes the damage done to a generation of graduates, for whom a degree has all but ceased to be a golden ticket to a decent job. Tuition fees in England almost tripled last year to a maximum £9,000 a year.
…Each cohort of graduates since the financial crisis is earning less than the one before. New graduates who earned £15,000 or more in 2011-12 – enough to start repaying their loans – were paid on average 12 per cent less in real terms than graduates at the same stage of their careers in 2007-08.
This real terms fall is three times as deep as the decline in average pay for all full-time workers over the same period.
From the FT there is more here.
American schools seem to be getting safer
From Greg Toppo:
It’d be easy to conclude that school has never been a more dangerous place, but for the USA’s 55 million K-12 students and 3.7 million teachers, statistics tell another story: Despite two decades of high-profile shootings, school increasingly has become a safer place.
…By nearly every measure, safety has improved and violence has dropped for students and teachers, according to recent findings issued jointly by the Justice Department and Education Department.
The data do not include post-2011, but still the overall trends, as outlined in the longer article, seem pretty clear.
*Fortune Tellers: The Story of America’s First Economic Forecasters*
The author is Walter A. Friedman and the Amazon link is here. It is a good and readable look at a neglected corner of the history of economic thought, covering Roger Babson, Irving Fisher, John Moody, Warren Persons, Wesley Mitchell, and others. Here is one bit:
At Yale, [Irving] Fisher conducted dietary experiments with student athletes in ways that no university today would allow. These included one test that compared athletes who chewed their food thoroughly against those who did not and one that pitted the endurance of meat eaters against vegetarians. He gained enough authority as a nutrition expert for the makers of the cereal grape-Nuts to include his endorsement in a 1907 advertisement. It mentioned Fisher’s experiments on yale students “to determine the effects of the thorough mastication of food.” Fisher, the ad claimed, found that their endurance was increased 50 percent, although they took no more exercise than before and has reduce their consumption of “flesh foods” by five-sixths. Fisher also chaired a nationwide Committee of One Hundred on National Health that wrote reports and built a network of experts and public figures to agitate for “increased federal regulation of public health” — specifically, a cabinet-level department of health.
…Health, according to Fischer, deserved as much attention from economists as import and export totals.
This is a book that John P. Cullity would have enjoyed.
How different are Democratic and Republic appointees to the Fed’s Board of Governors?
John Sides talks with Julio Suarez, who has been researching the topic:
Recently they don’t look much different at all. When you take the average member appointed by a Democratic president and the average member appointed by a Republican president, you observe what you expect: Since 1936, Democratic appointees are slightly more dovish than Republican appointees, although the difference is not statistically significant. The average score for a Democratic appointee is -0.22 vs. -0.08 for a Republican appointee.
There is more here, including a graph and a link to the underlying data.
IBM’s Watson will be made available in a more powerful form on the internet
Companies, academics and individual software developers will be able to use it at a small fraction of the previous cost, drawing on IBM’s specialists in fields like computational linguistics to build machines that can interpret complex data and better interact with humans.
That is a big deal, obviously. The story is here.
The changing income distribution for lawyers (Average is Over)
As of 2010, a graph of starting salaries looks like this:
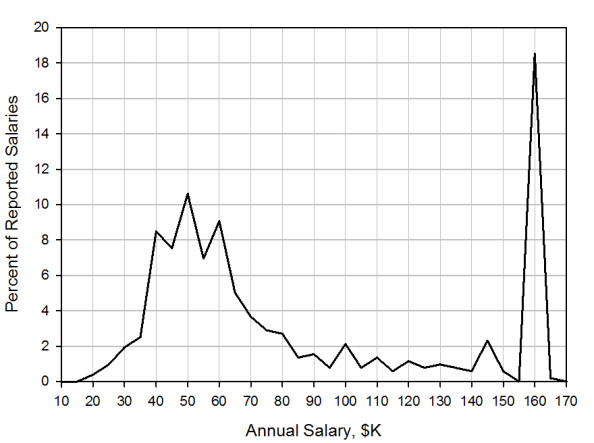
As of 1991, it looked like this:
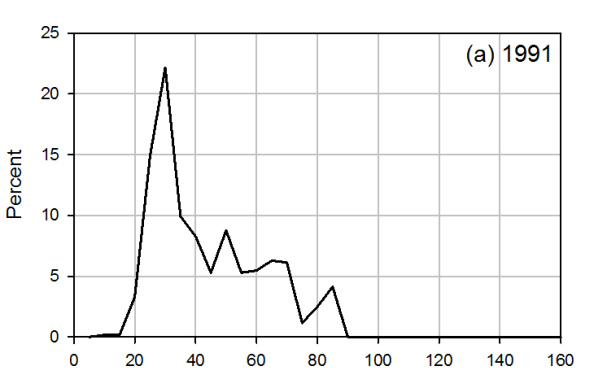
That is from Peter Turchin. Here is a WSJ article by Ben Casselman on the widening job market gap more generally.
Is a Ph.D. important for succeeding in finance?
There is a new paper by Ranadeb Chaudhuri, Zoran Ivkovich, Joshua Matthew Pollet, and Charles Trzcinka, the abstact is this:
Several hundred individuals who hold a Ph.D. in economics, finance, or others fields work for institutional money management companies. The gross performance of domestic equity investment products managed by individuals with a Ph.D. (Ph.D. products) is superior to the performance of non-Ph.D. products matched by objective, size, and past performance for one-year returns, Sharpe Ratios, alphas, information ratios, and the manipulation-proof measure MPPM. Fees for Ph.D. products are lower than those for non-Ph.D. products. Investment flows to Ph.D. products substantially exceed the flows to the matched non-Ph.D. products. Ph.D.s’ publications in leading economics and finance journals further enhance the performance gap.
For the pointer I thank Samir Varma, whose teenage daughter has a new book on iTunes here.
U.S. life expectancy in perspective
From Avik Roy:
A few years back, Robert Ohsfeldt of Texas A&M and John Schneider of the University of Iowa asked the obvious question: what happens if you remove deaths from fatal injuries from the life expectancy tables? Among the 29 members of the OECD, the U.S. vaults from 19th place to…you guessed it…first. Japan, on the same adjustment, drops from first to ninth.
Inflation Sentence of the Day
The Federal Reserve Bank of Cleveland reports that its latest estimate of 10-year expected inflation is 1.73 percent. In other words, the public currently expects the inflation rate to be less than 2 percent on average over the next decade.
Average is Over for public sector investment too
Medicare spending continues to rise, but in other areas we are seeing significant cuts:
Kirk Dale, the township supervisor of Marlette, Michigan, has first-hand experience of what it means to spend less on infrastructure. Thirty years ago, he felt his small town was on the rise when Cooper Road, a local residential street, was first paved. But today, Marlette cannot afford the maintenance and has joined a number of small communities that have pulverised their streets and gone back to gravel.
“You make a calculated, rational decision on which mile to do,” said Mr Dale, the township supervisor. “And then you look long-term down the line saying ‘Hey, even if we were to pave this, how are we going to repave this 10 or 15 years down the line?’”
Is that good news or bad news? By the way:
Gross capital investment by the public sector has dropped to just 3.6 per cent of US output compared with a postwar average of 5 per cent, according to figures compiled by the Financial Times.
The FT article is here.