Category: Economics
Model this
Where in that market do you want to be? Who is there? For how long will things stay like this?
I thank Christopher Balding for a related pointer.
The altruistic logic of Chinese air pollution?
Kai Xue writes:
But I say in plain honesty that terrible air pollution while taken as mandarin indifference to public demands is to the contrary a manifestation of commitment to a mass middle class by the Chinese political system.
Policy deliberately trades off public health for blue collar jobs. Around Beijing are industries including steel mills and cement plants that are major polluters. About 1 in 10 tonnes of the world’s steel output is smelted in Hebei, the province surrounding Beijing. With so much local heavy industry, cleaning the air would start with plant closures that cause concentrated unemployment.
Whether this bargain of clean air for economic growth is a good deal is a fair question but whether it is virtuous public policy depends on the extent decision-makers are subject to or instead insulated from the consequences of self-produced actions.
Beijing is the seat of power in a centralized state. About one third of the thousands who hold junior ministerial rank or higher and many of the very rich reside here.
Regardless of stature, for every Beijing inhabitant air pollution is the most serious public concern.
That is from an Atlantic article by James Fallows.
Larry Summers is starting to blog on his blog
Does China hitting the wall reflect a deeper reality about emerging economy growth?
It’s easy enough to say the Chinese economy is slowing down and that is creating problems for some other countries around the world. Never settle for such a comfortable understanding! Might there be deeper ways to think about the problem?
I am not endorsing any of the following speculative hypotheses, rather they are attempts to imbed the Chinese slowdown into what is possibly a broader framework. Here are a few possibilities:
1. We’ve been realizing that autocratic government isn’t as effective as we had thought.
2. We’ve been realizing that virtually all of the world’s emerging economies will be hit by “premature deindustrialization,” China included. China will produce more manufactured goods, but because of automation this will never build a fully-sized middle class in China. And historically service sector jobs have never had the same kind of oomph at lifting a nation over various development hurdles. The same limitations may apply to a variety of other countries.
3. Perhaps developing nations have reached “peak stuff”? That may mean the Chinese manufacturing model, along with the manufacturing models of other nations, will prove less potent than we had thought.
4. Maybe we’ve been learning that a demographic slowdown is harder to reverse, and is more costly for long-run growth, than we had thought.
5. The geopolitical stability of the South China Sea is not as robust as it seemed three or four years ago.
What else?
In each case the relevant realization may be popping China, and some other emerging economies, out of better multiple equilibria and into inferior multiple equilibria (“is Greece a Balkans nation or a European nation?”).
Again, I am not dismissing the highly relevant China-specific factors of excess capacity, high municipal debt, real estate bubble, and so on. I am simply wondering what other broader trends may be operating here beneath the surface.
Trading down and the business cycle
From the new NBER paper by Nir Jaimovich, Sergio Rebelo, and Arlene Wong:
We document two facts. First, during recessions consumers trade down in the quality of the goods and services they consume. Second, the production of low-quality goods is less labor intensive than that of high-quality goods. So, when households trade down, labor demand falls, increasing the severity of recessions. We find that the trading-down phenomenon accounts for a substantial fraction of the fall in U.S. employment in the recent recession. We study two business cycle models that embed quality choice and find that the presence of quality choice magnifies the response of these economies to real and monetary shocks.
In other words, we should subsidize relatively expensive goods as a downturn approaches…and tax thrift shops at a higher rate…?
Why am I not seeing anyone back out the implied growth rate from these numbers?
The 13.8% decline in imports was significantly worse than consensus expectations for an 8.2% decline, and will only add to concerns over declining Chinese demand.
Under what required assumptions would this translate into a growth rate of say four percent? Backward-looking? Forward-looking? Or is this just a slow structural shift as the Chinese economy gradually moves into services? Inquiring minds wish to know.
The full report is here.
What Henny Sender says about China
“It is neither the sell-off in Chinese stocks nor weakness in the currency that matters most,” notes George Saravelos, a currency strategist in London with Deutsche Bank. “It is what is happening to China’s FX reserves and what this means for global liquidity. The People’s Bank of China’s actions are equivalent to an unwind of QE or, in other words, Quantitative Tightening.”
The FT story is here. Another way to put it is that a weaker Chinese currency will mean stronger currencies elsewhere and thus net deflationary pressure.
Damned if they do, damned if they don’t
The Syrian-Lebanese have a long history in Haiti, and in fact they account for most of Haiti’s very wealthiest families. They are also sometimes resented by the other Haitians for their extreme commercial success. Here is one illustrative but not fully objective account from Wikipedia:
Since the early twentieth century there was a Syrian community in Haiti. This consisted of roughly 500 people, mainly engaged in trade and many of them were Syrian Americans. The entire business community of Syrians, however, tended to sell their products to the United States. Over time, the importance of these merchant foreigners grew, reaching positions in the political order of the country. It is of enormous importance to the country, that surpassing most of the Haitians in government (one that was formed by the social elite of Haiti, against a poor majority), caused major uprisings against the Syrians and the idea widespread among Haitians was that they should be deported. Therefore, the Syrian American club sent a letter to the U.S. State Department of Washington D.C., explaining the reasons why the island was purchased for trade with the U.S. and asked for help and advice from the U.S. Federal Government. At that time the Syrians had also addressed the majority of imports of goods to Haiti, both in the field of provisions as in beverages. Syrian traders also were, at present, the only foreign traders willing to work under native conditions than other groups of traders that were rejected. So, they sold wholesale. However, these traders were occupied all trades with the country, which made them gain rejection of a significant part of the population. Thus, the Haitian government launched a new political program that limited the Syrian trade in the country.
Of course Haiti could take in more “Syrian-Lebanese” too, but this would be unpopular in some circles because…the previously Syrian-Lebanese have been…too successful.
*Foolproof: Why Safety Can Be Dangerous and How Danger Makes Us Safe*
The new Greg Ip book is coming out soon, I just bought my copy…
The Costs of Occupational Licensing
On Labor Day let’s all read the excellent White House report on occupational licensing:
…the current licensing regime in the United States also creates substantial costs, and often the requirements for obtaining a license are not in sync with the skills needed for the job. There is evidence that licensing requirements raise the price of goods and services, restrict employment opportunities, and make it more difficult for workers to take their skills across State lines. Too often, policymakers do not carefully weigh these costs and benefits when making decisions about whether or how to regulate a profession through licensing. In some cases, alternative forms of occupational regulation, such as State certification, may offer a better balance between consumer protections and flexibility for workers.
The Frechet Probability Bounds — Super Wonky!
I recently ran across a problem using the Frechet probability bounds. The bounds weren’t immediately obvious to me and Google didn’t enlighten so I wrote an intuitive explanation. Super wonkiness to follow. You have been warned.
Suppose that we have two events A and B which occur with probability P(A) and P(B). We are interested in saying something about the joint event P(A∩B), the probability that both events occur, but we don’t know anything about whether the events are correlated or independent. Can we nevertheless say something about the joint event P(A∩B)? We can. The Frechet bounds or inequalities tell us:
max[0,P(A)+P(B)-1] ≤ P(A∩B) ≤ min[P(A),P(B)]
In words, the probability of the joint event can’t be smaller than max[0,P(A)+P(B)-1] or bigger than min[P(A),P(B)]. Let’s give an intuitive explanation.
The events themselves are not important only the probabilities so let’s use an intuitive model for the events. Let x be a random number distributed between 0 and 1 with each number equally likely (i.e. a uniform distribution). Suppose that the event A occurs whenever x is in some region between a and b. For example, we might say that event A occurs if x is between .4 and .6 and event B occurs if x is between .1 and .7. Notice also that since any number between 0 and 1 is equally likely the probability that event A occurs is just the width of the A region, b-a. In this case, for example, P(A)=.6-.4=.2 and similarly P(B)=.7-.1=.6.
Now suppose that a demon arranges the events A and B to minimize the probability that both events occur. What is the smallest the demon could make P(A∩B)? To minimize the probability that both A and B occur we can think of the demon as placing the two events “as far apart” as possible. For example, the demon will begin one event at 0 and define it as the region moving right until the width is equal to P(A) and the other event the demon will begin at 1 and move left until the width is equal to P(B). If P(A)=.2 and P(B)=.4, for example, then the demon will define the events so that A∈[0,.2] and B∈[.6,1]. Here’s a picture. Notice that by beginning one event at 0 and the other at 1 the demon minimizes the overlap which is the probabiity that both events occur.
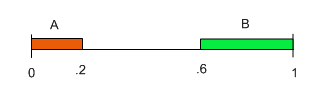 In this case, the events don’t overlap at all and so the demon has ensured that the probability of P(A∩B)=0.
But what if the two events must overlap? Suppose for example that P(A)=.5 and P(B)=.7 then the demon’s logic of minimization leads to the following picture:
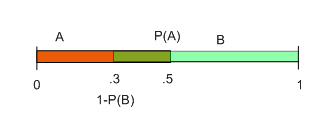 We can see from the picture that the overlap is the region between .3 and .5 which we know has probability .5-.3=0.2. Thus we have discovered that if P(A)=.5 and P(B)=.7 then the joint probability has to be at least .2, i.e. .2≤P(A∩B).
Now let’s generalize. The probability of any event occuring is the length of its region b-a but since the demon always begins the event A at 0 then the probability of P(A) is simply b the rightmost point of the A region. Thus, on the diagram the rightmost point of the A region is labelled P(A) (.5 in this case). Also since the demon always begins the B region at 1, P(B)=1-a′ where a′ is the leftmost point of the B region so rearranging we have that the leftmost point a′=1-P(B) as shown in the picture at .3. Thus, we can read immediately from the figure that the overlap region has length P(A)-(1-P(B)). Notice that if P(A)<1-P(B) then there is no overlap and the difference is a negative number. Rearranging slightly, the length of the overlap region is P(A)+P(B)-1. So now we have two cases, either there is no overlap at all in which case P(A∩B)=0 or there is overlap and P(A∩B)=P(A)+P(B)-1. So putting it all together we have proven that:
max[0,P(A)+P(B)-1] ≤ P(A∩B)
The Frechet bounds also say:
P(A∩B) ≤ min[P(A),P(B)]
This is much easier to show. If minimization is accomplished by minimizing the overlap then maximization is accomplished by maximizing the overlap. To maximize the joint probability the demon starts both regions at the same point, say at the 0 point, so the picture looks like this:
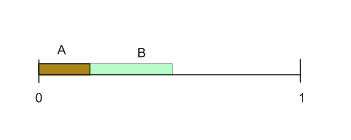 The joint probability is then the region of overlap. But the regions can’t overlap by more than the smallest of the two regions! In this case the A region is smaller than the B region and since the regions start at 0 we have P(A∩B)≤P(A). Generalizing we have that:
P(A∩B) ≤ min[P(A),P(B)]
Thus we have proven the Frechet bounds:
max[0,P(A)+P(B)-1] ≤ P(A∩B) ≤ min[P(A),P(B)]
Addendum: Here is Heckman on the theory of Frechet Bounds and Heckman and Smith and Heckman, Smith and Clements with applications.
Online lending is overrated
So the industry turned instead to the wholesale markets. Hedge funds and investment banks have proved a much easier sell. Not surprising, perhaps, when average rates on a Lending Club loan are between 7.5 per cent and 25 per cent and bond fund returns are closer to 2 per cent. Institutions now make up about four-fifths of many US operators’ funding. That allows some of the largest marketplace lenders to grow at more than 100 per cent a year. But it also makes them look a lot less like financial innovators — and more like finance companies of yore.
The FT piece by Jonathan Ford is interesting throughout, for instance he emphasizes that new business in these markets is drummed up only slowly and the sector depends on origination fees of one kind or another. One possible outcome is that these online lenders will be bought out by banks. Yet:
The snag is that banks trade on just 10 to 12 times earnings. Even after recent share price falls, that is far below the valuations that listed marketplace lenders enjoy.
Stay tuned, but the great stagnation for finance is in my view likely to continue…
China and the Great Depression of the 1930s
I learned a good deal reading Ramon H. Myers’s essay “The World Depression and the Chinese Economy 1930-6” in Ian Brown’s The Economies of Africa and Asia in the Inter-war Depression. Here are a few of his points:
1. In the 1920s, per capita growth in China was probably around 0.33 percent a year, one percent a year in absolute terms. I would add the notion that the country already was on an explosive growth path does not seem borne out by these estimates.
2. The Chinese financial system at the time was quite free-wheeling and money flowed into China to facilitate the country’s 1915-1930 growth.
3. By the late 1920s, China’s exports were only about 2 to 3 percent of gdp.
4. The Japanese seized Manchuria 1931-32, and the region had been accounting for a significant portion of China’s industrial growth.
5. The loss of Manchuria excepted, Chinese internal growth rose about 11.6 percent a year across 1930-36. It seems the country just wasn’t hit that hard by the global Great Depression.
6. There was sustained deflation during 1931-1935; some of this ties in to complex developments in the silver market, as China was on a silver standard. Yet economic activity still expanded. Silver flowed out of the country, but there was a big boost in credit and “inside money.”
7. As an aside, had I mentioned that the Nanjing government only firmly controlled two provinces of the country as of 1935, with “minimal control” in eight others?
8. Shanghai grew throughout most of the 1930s, with exceptions for the Japanese attack and the Yangtse flood of 1931.
Myers’s conclusion that the Great Depression did not hit China so hard has been challenged (pdf), but so far his account is the most convincing I have found. China during the Great Depression remains an understudied topic.
A very good sentence
First, central banks don’t spend $150 billion every three weeks, or about $200 billion a month, to support a currency that is close to appropriately valued.
That is from Christopher Balding. Here is more:
Second, if you look at a list of major currencies and their move against the dollar over the past year, China is the extreme outlier in that the RMB has only dropped 2% compared to most currencies which have lost 10-30%. If China is even on the low end of a fall relative to the US dollar, it would need to drop at least 10% and a middle of the pack fall would require it to drop about 20%.
Ladies and gentlemen, lay your bets…
Robert Whaley speaks
On my iPhone are 55 albums by Bob Dylan, 16 albums by Leonard Cohen and 34 albums by Steve Earle. That’s all I listen to. It’s the storytelling in their lyrics. Dylan’s album “Tempest” is one of his best. The title song is a haunting 14-minute song about the sinking of the Titanic. I have every one of his albums except the last one where he interprets Frank Sinatra. That was out of line. He must have needed money. And I actually bumped into Steve Earle at the airport and introduced myself. My wife was just disgusted that I’d go and bother him, but he was very receptive. No, I did not tell him I developed the volatility indices.
Here is the rest of the interview.