Category: Data Source
Did market power go up so much?
It seems not:
De Loecker et al. (2020) (DEU) estimate that markups increased significantly in the United States from 1955 to 2016. We find this result is sensitive to unreported sample restrictions that drop 27% of the available observations. Applying the methodology as described in the article to the full sample, markup increases are more muted until late in the sample period, and are almost entirely driven by Finance and Insurance firms. If these firms are removed, markup increases are modest. We conclude that the DEU methodology and data, as they are described in the article, do not support the conclusion that broad-based increases in market power have occurred in recent decades.
That is from a recent NBER working paper by Benkard, Miller, and Yurukoglu.
Quantifying human-AI synergy
From Christoph Riedl and Ben Weidmann:
We introduce a novel Bayesian Item Response Theory framework to quantify human–AI synergy, separating individual and collaborative ability while controlling for task difficulty in interactive settings. Unlike standard static benchmarks, our approach models human–AI performance as a joint process, capturing both user-specific factors and moment-to-moment fluctuations. We validate the framework by applying it to human–AI benchmark data (n=667) and find significant synergy. We demonstrate that collaboration ability is distinct from individual problem-solving ability. Users better able to infer and adapt to others’ perspectives achieve superior collaborative performance with AI–but not when working alone. Moreover, moment-to-moment fluctuations in perspective taking influence AI response quality, highlighting the role of dynamic user factors in collaboration. By introducing a principled framework to analyze data from human-AI collaboration, interactive benchmarks can better complement current single-task benchmarks and crowd-assessment methods. This work informs the design and training of language models that transcend static prompt benchmarks to achieve adaptive, socially aware collaboration with diverse and dynamic human partners.
Here is a useful tweet storm on the work. I do not love how the abstract is written, I would stress these sentences: “We demonstrate that collaboration ability is distinct from individual problem-solving ability. Users better able to infer and adapt to others’ perspectives achieve superior collaborative performance with AI–but not when working alone. Moreover, moment-to-moment fluctuations in perspective taking influence AI response quality, highlighting the role of dynamic user factors in collaboration.”
Does studying economics and business make students more conservative?
College education is a key determinant of political attitudes in the United States and other countries. This paper highlights an important source of variation among college graduates: studying different academic fields has sizable effects on their political attitudes. Using surveys of about 300,000 students across 500 U.S. colleges, we find several results. First, relative to natural sciences, studying social sciences and humanities makes students more left-leaning, whereas studying economics and business makes them more right-leaning. Second, the rightward effects of economics and business are driven by positions on economic issues, whereas the leftward effects of humanities and social sciences are driven by cultural ones. Third, these effects extend to behavior: humanities and social sciences increase activism, while economics and business increase the emphasis on financial success. Fourth, the effects operate through academic content and teaching rather than socialization or earnings expectations. Finally, the implications are substantial. If all students majored in economics or business, the college–noncollege ideological gap would shrink by about one-third. A uniform-major scenario, in which everyone studies the same field, would reduce ideological variance and the gender gap. Together, the results show that academic fields shape students’ attitudes and that field specialization contributes to political fragmentation.
That is a recent paper from Yoav Goldstein and Matan Kolerman. Here is a thread on the paper.
Colors of growth
This looks pretty tremendous:
We develop a novel approach to measuring long-run economic growth by exploiting systematic variation in the use of color in European paintings. Drawing inspiration from the literature on nighttime lights as a proxy for income, we extract hue, saturation, and brightness from millions of pixels to construct annual indices for Great Britain, Holland, France, Italy, and Germany between 1600 and 1820. These indices track broad trends in existing GDP reconstructions while revealing higher frequency fluctuations – such as those associated with wars, political instability, and climatic shocks – that traditional series smooth over. Our findings demonstrate that light, decomposed into color and brightness components, provides a credible and independent source of information on early modern economic activity.
That is new research by Lars Boerner, Tim Reinicke, Samad Sarferaz, and Battista Severgnini. Via Ethan Mollick.
Planning sentences to ponder
Planning assistance caused municipalities to build 20% fewer housing units per decade over the 50 years that followed.
Here is the full abstract:
We study how the federal Urban Planning Assistance Program, which subsidized growing communities in the 1960s to hire urban planners to draft land-use plans, affected housing supply. Using newly digitized records merged with panel data across municipalities on housing and zoning outcomes, we exploit eligibility thresholds and capacity to approve funds across state agencies to identify effects. Planning assistance caused municipalities to build 20% fewer housing units per decade over the 50 years that followed. Regulatory innovation steered construction in assisted areas away from apartments and toward larger single-family homes. Textual evidence related to zoning and development politics further shows that, since the 1980s, assisted communities have disincentivized housing supply by passing on development costs to developers. These findings suggest that federal intervention in planning helped institutionalize practices that complicate community growth, with subsequent consequences for national housing affordability.
Hail Martin Anderson! The above paper is by Tom Cui and Beau Bressler, via Brad, and also Yonah Freemark.
Congressional leadership is corrupt
Using transaction-level data on US congressional stock trades, we find that lawmakers who later ascend to leadership positions perform similarly to matched peers beforehand but outperform them by 47 percentage points annually after ascension. Leaders’ superior performance arises through two mechanisms. The political influence channel is reflected in higher returns when their party controls the chamber, sales of stocks preceding regulatory actions, and purchase of stocks whose firms receiving more government contracts and favorable party support on bills. The corporate access channel is reflected in stock trades that predict subsequent corporate news and greater returns on donor-owned or home-state firms.
That is from a new NBER working paper by Shang-Jin Wei and Yifan Zhou. Of course Alex T. has been on this issue for a long time now.
Meta-analytical effect of economic inequality on well-being or mental health
Some of us have known this for some time:
Exposure to economic inequality is widely thought to erode subjective well-being and mental health, which carries important societal implications. However, existing studies face reproducibility issues, and theory suggests that inequality only affects individuals in disadvantaged contexts. Here we present a meta-analysis of 168 studies using multilevel data (11,389,871 participants from 38,335 geographical units) identified across 10 bibliographical databases (2000–2022). Contrary to popular narratives, random-effects models showed that individuals in more unequal areas do not report lower subjective well-being (standardized odds ratio (OR+0.05) = 0.979, 95% confidence interval = 0.951–1.008). Moreover, although inequality initially seemed to undermine mental health, the publication-bias-corrected association was null (OR+0.05 = 1.019; 0.990–1.049)17. Meta-analytical effects were smaller than the smallest effect of interest, and specification curve analyses confirmed these results across ≈95% of 768 alternative models. When assessing study quality and certainty of evidence using ROBINS-E and GRADE criteria, ROBINS-E rated 80% of studies at high risk of bias, and GRADE assigned greater certainty to the null effects than to the negative effects. Meta-regressions revealed that the adverse association between inequality and mental health was confined to low-income samples. Moreover, machine-learning analyses19 indicated that the association with well-being was negative in high-inflation contexts but positive in low-inflation contexts. These moderation effects were replicated using Gallup World Poll data (up to 2 million participants). These findings challenge the view that economic inequality universally harms psychological health and can inform public health policy.
That is now published in Nature, by Nicholas Sommet, et.al., via the excellent Kevin Lewis.
Race and economic well-being in the United States
We construct a measure of consumption-equivalent welfare for Black and White Americans, which incorporates life expectancy, consumption, leisure, and inequality. Based on these factors, welfare for Black Americans was 40 percent of that for White Americans in 1984 and 59 percent by 2022. There has been remarkable progress for Black Americans: The level of their consumption-equivalent welfare increased by a factor of 3.5 over the last 38 years when aggregate consumption per person only doubled. Despite this progress, the welfare gap in 2022 remains disconcertingly large at 41 percent, much larger than the 16 percent gap in consumption per person.
That is from a new article by Jean-Félix Brouillette, Charles I. Jones, and Peter J. Klenow, just published in American Economic Journal: Insights.
Enlightenment ideas and the belief in progress leading up to the Industrial Revolution
Using textual analysis of 173,031 works printed in England between 1500 and 1900, we test whether British culture evolved to manifest a heightened belief in progress associated with science and industry. Our analysis yields three main findings. First, there was a separation in the language of science and religion beginning in the 17th century. Second, scientific volumes became more progress-oriented during the Enlightenment. Third, industrial works—especially those at the science-political economy nexus—were more progress-oriented beginning in the 17th century. It was therefore the more pragmatic, industrial works which reflected the cultural values cited as important for Britain’s takeoff.
That is from a paper by Ali Almelhem, Murat Iyigun, Austin Kennedy, and Jared Rubin. Now forthcoming at the QJE.
Some second-order effects of unaffordable housing
This is one of the best, most interesting, and most important papers I have seen of late:
Housing affordability has declined sharply in recent decades, leading many younger generations to give up on homeownership. Using a calibrated life-cycle model matched to U.S. data, we project that the cohort born in the 1990s will reach retirement with a homeownership rate roughly 9.6 percentage points lower than that of their parents’ generation. The model also shows that as households’ perceived probability of attaining homeownership falls, they systematically shift their behavior: they consume more relative to their wealth, reduce work effort, and take on riskier investments. We show empirically that renters with relatively low wealth exhibit the same patterns. These responses compound over the life cycle, producing substantially greater wealth dispersion between those who retain hope of homeownership and those who give up. We propose a targeted subsidy that lifts the largest number of young renters above the “giving-up threshold.” This policy yields welfare gains that are 3.2 times those of a uniform transfer and 10.3 times those of a transfer targeted to the bottom 10% of the wealth distribution, while also increasing homeownership rate, raising work effort, and reducing reliance on the social safety net.
That is from Seung Hyeong Lee of Northwestern and Younggeun Yoo of University of Chicago. Via the excellent Kevin Lewis.
Do (human) readers prefer AI writers?
It seems so, do read through the whole abstract:
The use of copyrighted books for training AI models has led to numerous lawsuits from authors concerned about AI’s ability to generate derivative content. Yet it’s unclear whether these models can generate high quality literary text while emulating authors’ styles/voices. To answer this we conducted a preregistered study comparing MFA-trained expert writers with three frontier AI models: ChatGPT, Claude, and Gemini in writing up to 450 word excerpts emulating 50 awardwinning authors’ (including Nobel laureates, Booker Prize winners, and young emerging National Book Award finalists) diverse styles. In blind pairwise evaluations by 159 representative expert (MFA-trained writers from top U.S. writing programs) and lay readers (recruited via Prolific), AI-generated text from in-context prompting was strongly disfavored by experts for both stylistic fidelity (odds ratio [OR]=0.16, p < 10^-8) and writing quality (OR=0.13, p< 10^-7) but showed mixed results with lay readers. However, fine-tuning ChatGPT on individual author’s complete works completely reversed these findings: experts now favored AI-generated text for stylistic fidelity (OR=8.16, p < 10^-13) and writing quality (OR=1.87, p=0.010), with lay readers showing similar shifts. These effects are robust under cluster-robust inference and generalize across authors and styles in author-level heterogeneity analyses. The fine-tuned outputs were rarely flagged as AI-generated (3% rate versus 97% for incontext prompting) by state-of-the-art AI detectors. Mediation analysis reveals this reversal occurs because fine-tuning eliminates detectable AI stylistic quirks (e.g., cliché density) that penalize incontext outputs, altering the relationship between AI detectability and reader preference. While we do not account for additional costs of human effort required to transform raw AI output into cohesive, publishable novel length prose, the median fine-tuning and inference cost of $81 per author represents a dramatic 99.7% reduction compared to typical professional writer compensation. Author-specific fine-tuning thus enables non-verbatim AI writing that readers prefer to expert human writing, thereby providing empirical evidence directly relevant to copyright’s fourth fair-use factor, the “effect upon the potential market or value” of the source works.
That is from a new paper by Tuhin Chakrabarty, Jane C. Ginsburg, and Paramveer Dhillon. For the pointer I thank the excellent Kevin Lewis. I recall an earlier piece showing that LLMs also prefer LLM outputs?
The Effect of Video Watching on Children’s Skills
This paper documents video consumption among school-aged children in the U.S. and explores its impact on human capital development. Video watching is common across all segments of society, yet surprisingly little is known about its developmental consequences. With a bunching identification strategy, we find that an additional hour of daily video consumption has a negative impact on children’s noncognitive skills, with harmful effects on both internalizing behaviors (e.g., depression) and externalizing behaviors (e.g., social difficulties). We find a positive effect on math skills, though the effect on an aggregate measure of cognitive skills is smaller and not statistically significant. These findings are robust and largely stable across most demographics and different ways of measuring skills and video watching. We find evidence that for Hispanic children, video watching has positive effects on both cognitive and noncognitive skills—potentially reflecting its role in supporting cultural assimilation. Interestingly, the marginal effects of video watching remain relatively stable regardless of how much time children spend on the activity, with similar incremental impacts observed among those who watch very little and those who watch for many hours.
That is from a new NBER working paper by
Mexico estimates of the day
Ms Sheinbaum’s government says Mexico’s murder rate has come down by 32% in the year since she took office. Analysis by The Economist confirms that the rate has fallen, though by a significantly smaller margin, 14%. Counting homicides alone misses an important part of the picture, namely the thousands of people who disappear in Mexico every year, many of whom are killed and buried in unmarked graves. A broader view of deadly crime that includes manslaughter, femicide and two-thirds of disappearances (the data for disappearances is imperfect), shows a more modest decline of 6% (see chart). Still, Mexico is on track for about 24,300 murders this year, horribly high, but well below the recent annual average of slightly over 30,000. Ms Sheinbaum is the first Mexican leader in years to push violent crime in the right direction.
Here is more from The Economist.
One-Third of US Families Earn Over $150,000
It’s astonishing that the richest country in world history could convince itself that it was plundered by immigrants and trade. Truly astonishing.
From Jeremy Horpedahl who notes:
This is from the latest Census release of CPS ASEC data, updated through 2024 (see Table F-23 at this link).
In 1967, only 5 percent of US families earned over $150,000 (inflation adjusted).
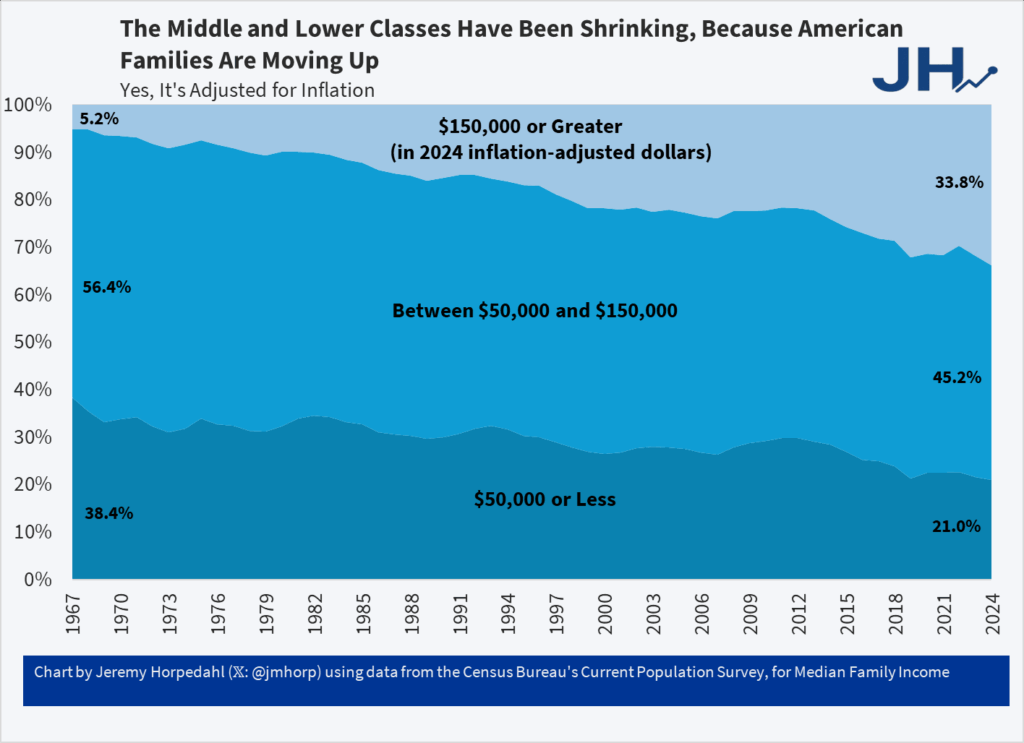
And even though it says so in the chart and in the text let me say it again, this is inflation adjusted and so yes it’s real and no the fact that housing has gone up in price doesn’t negate this, it’s built in. We would have done even better had NIMBYs not reduced the supply of housing.
See also Asness and Strain.
Addendum: Note it isn’t the rise of dual-earner households which haven’t increased for over 30 years.
Old school workplace feminization
We investigate whether consequential decisions made by judges are impacted by the gender composition of these judges’ peer group. Using the universe of decisions on juvenile defendants in each courthouse in a Southern state over 15 years, we estimate two-way fixed effects models leveraging random assignment of cases to judges and variations in judge peer composition generated by judicial turnover. The results show that an increase in the proportion of female peers in the courthouse causes a rise in individual judges’ propensity to incarcerate, and an increase in prison time. This effect is driven by the behavior of female judges. We examine the sensitivity of our findings to heterogeneous-robust difference-in-differences estimators for continuous and nonabsorbing treatments.
Here is the full article by Ozkan Eren and Naci Mocan, tekl.